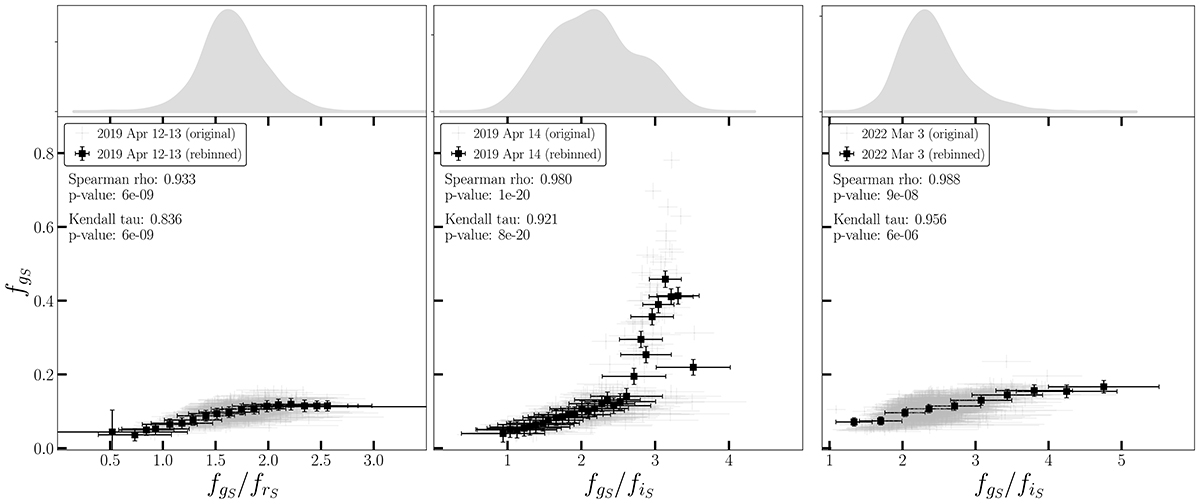
Fig. 2.
Download original image
Colour-intensity diagrams of J1109 extracted from the most highly sampled gS and iS band NTT/ULTRACAM time series. Grey dots represent data points from the original time series, while black squares represent rebinned data points. All intensities have been corrected for extinction effects (see text for details). The results of the correlation tests performed on the rebinned data points are reported in the panels. The top panels display the kernel density estimation smoothing curves for the distribution of the colour values.
Current usage metrics show cumulative count of Article Views (full-text article views including HTML views, PDF and ePub downloads, according to the available data) and Abstracts Views on Vision4Press platform.
Data correspond to usage on the plateform after 2015. The current usage metrics is available 48-96 hours after online publication and is updated daily on week days.
Initial download of the metrics may take a while.