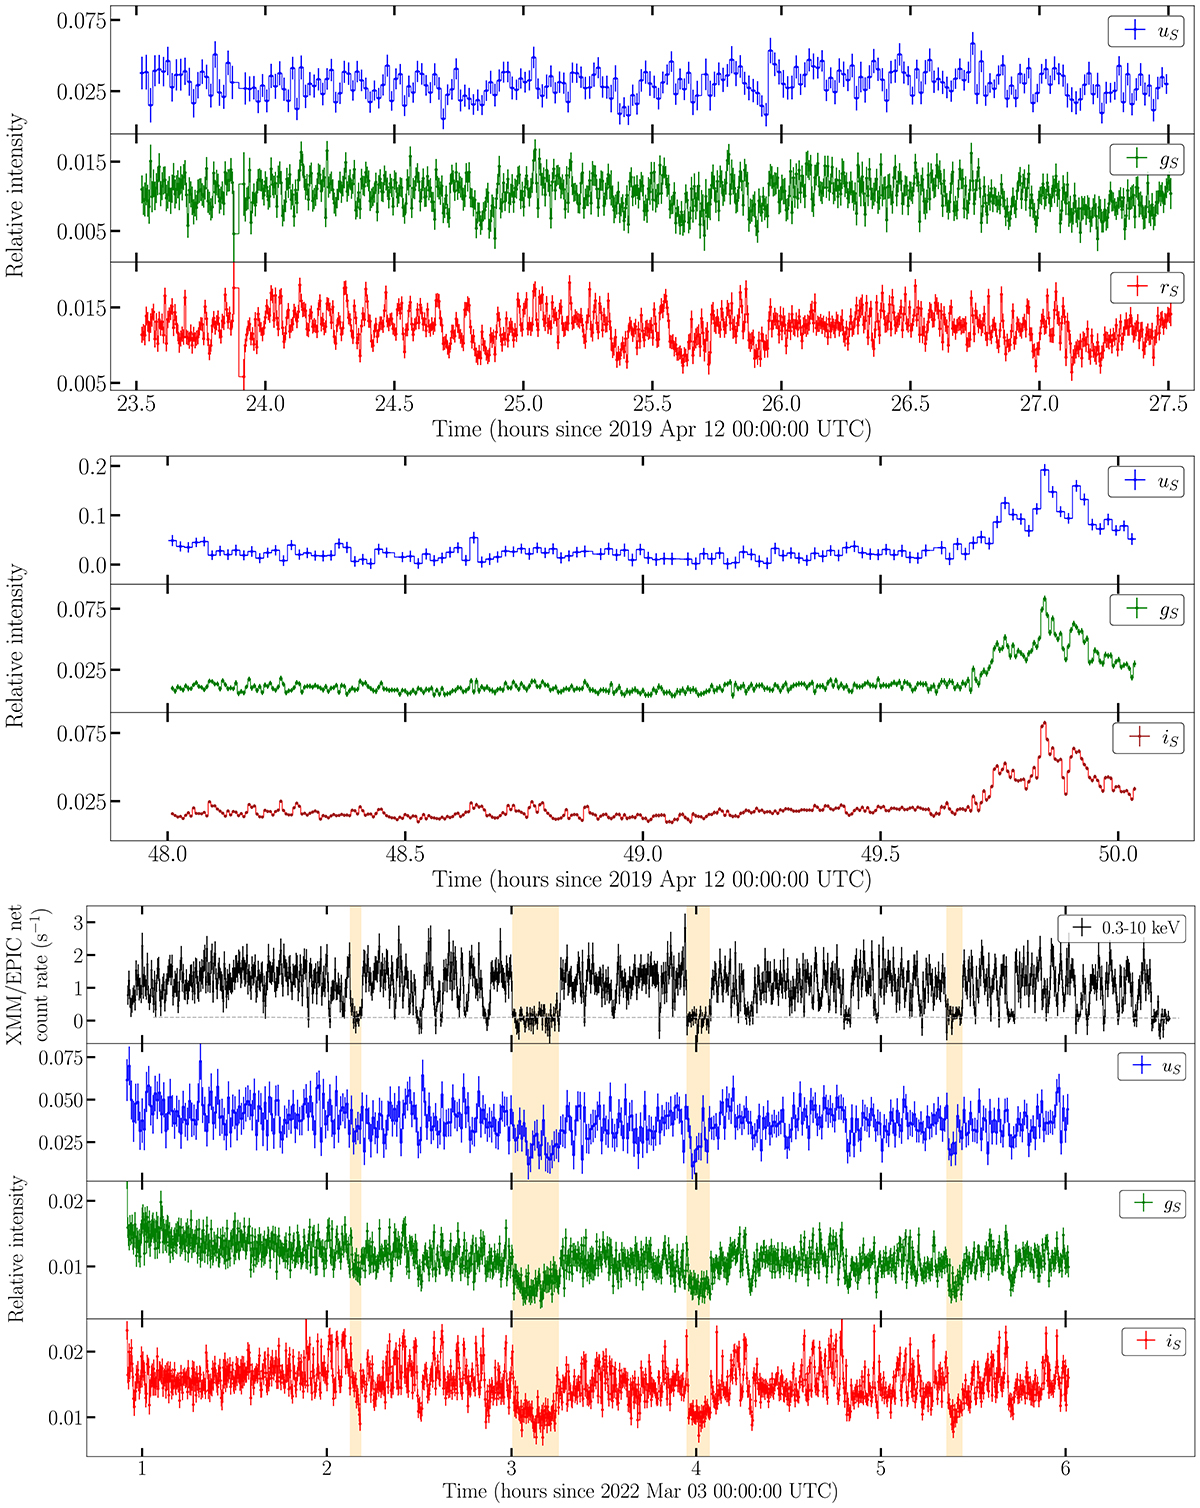
Fig. 1.
Download original image
Multi-wavelength time series of J1109 presented in this work. Top: NTT/ULTRACAM (2019 April 12-13). Middle: NTT/ULTRACAM (2019 April 14). Bottom: XMM-Newton/EPIC (pn+MOSs) and NTT/ULTRACAM (2022 March 3). The grey dashed line represents the XMM-Newton/EPIC background level, whereas the orange shaded areas mark the four longest episodes of low mode, which were used to compute the low-mode ingress and egress timescales in X-rays (see text for details). Different vertical scales have been used for the optical time series in the different panels.
Current usage metrics show cumulative count of Article Views (full-text article views including HTML views, PDF and ePub downloads, according to the available data) and Abstracts Views on Vision4Press platform.
Data correspond to usage on the plateform after 2015. The current usage metrics is available 48-96 hours after online publication and is updated daily on week days.
Initial download of the metrics may take a while.