Fig. 8.

Download original image
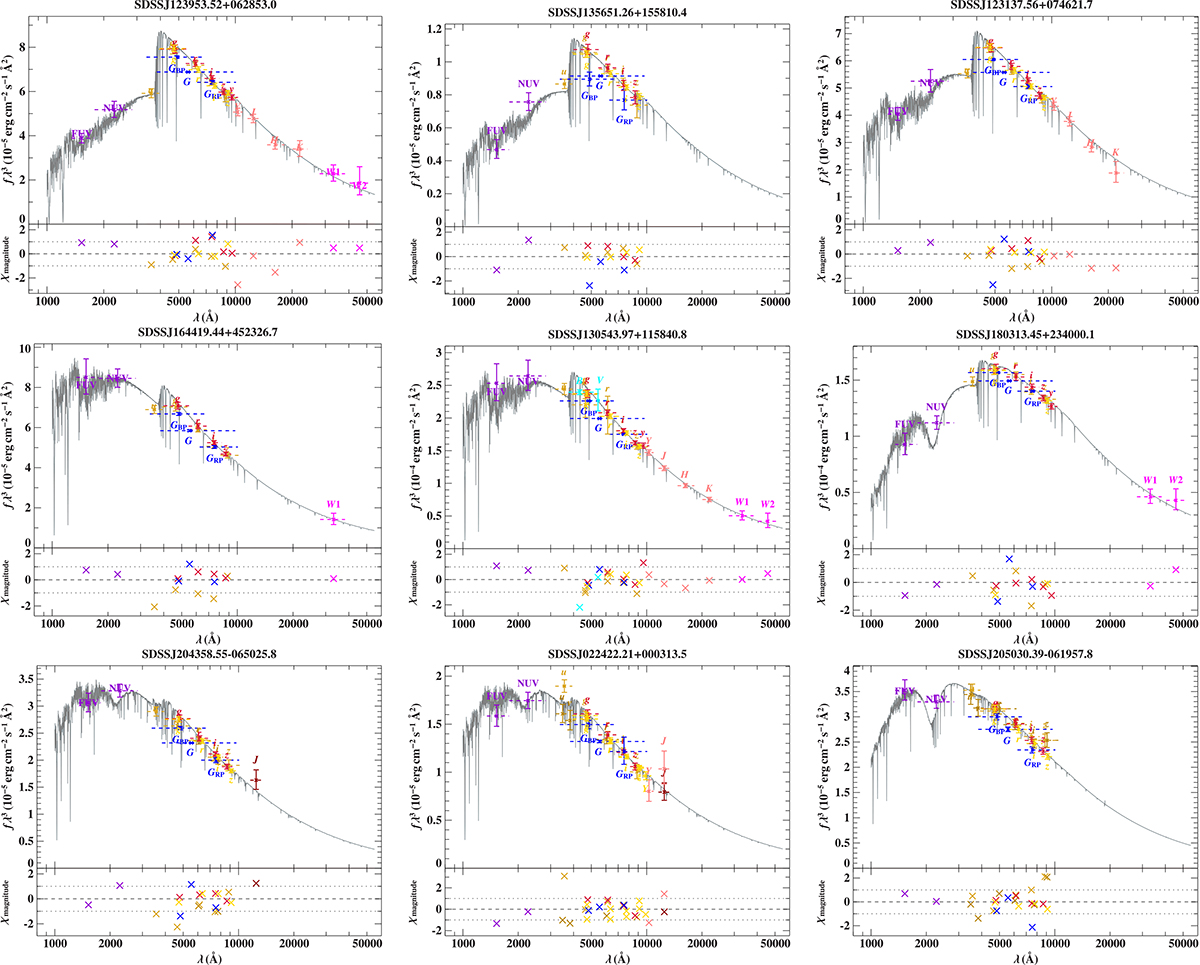
Fits of SEDs of selected programme stars. Each plot consists of two panels; the upper one compares the observed fluxes to the synthetic SED. To ease the slope of the distribution the flux is multiplied by the wavelength to the power of three. Photometric fluxes are displayed as coloured data points (for details see Table A.2) with their respective uncertainties and filter widths (dashed lines). The best-fit models are drawn as full grey lines. The lower panels give reduced χ to demonstrate the quality of the fit. Example fits are selected to demonstrate relevant issues. In each row, the stars are arranged with increasing temperature. Top row: He-weak sdB stars: cool sdB J123953.52+062853.0, which is the most distant programme star; J135651.26+155810.4, the sdB with the largest (positive) heliocentric RV; and J123137.56+074621.7. Middle row: sdOB stars: J164419.44+452326.7; the low gravity J130543.97+115840.8; and the highly reddened J180313.45+234000.1. Bottom row: He-sdO stars: iHe-sdOB J204358.55–065025.8; the best observed iHe-sdOB star J022422.21+000313.5; and the eHe-sdO J205030.39–061957.8, which was considered a spectroscopic twin to US 708 by Ziegerer et al. (2017). The strong colour excess of J180313.45+234000.1 and J205030.39–061957.8 is most obvious from the strength of the 2200 Å UV feature effecting the GALEX NUV band.
Current usage metrics show cumulative count of Article Views (full-text article views including HTML views, PDF and ePub downloads, according to the available data) and Abstracts Views on Vision4Press platform.
Data correspond to usage on the plateform after 2015. The current usage metrics is available 48-96 hours after online publication and is updated daily on week days.
Initial download of the metrics may take a while.


