Open Access
Fig. 6.
Download original image
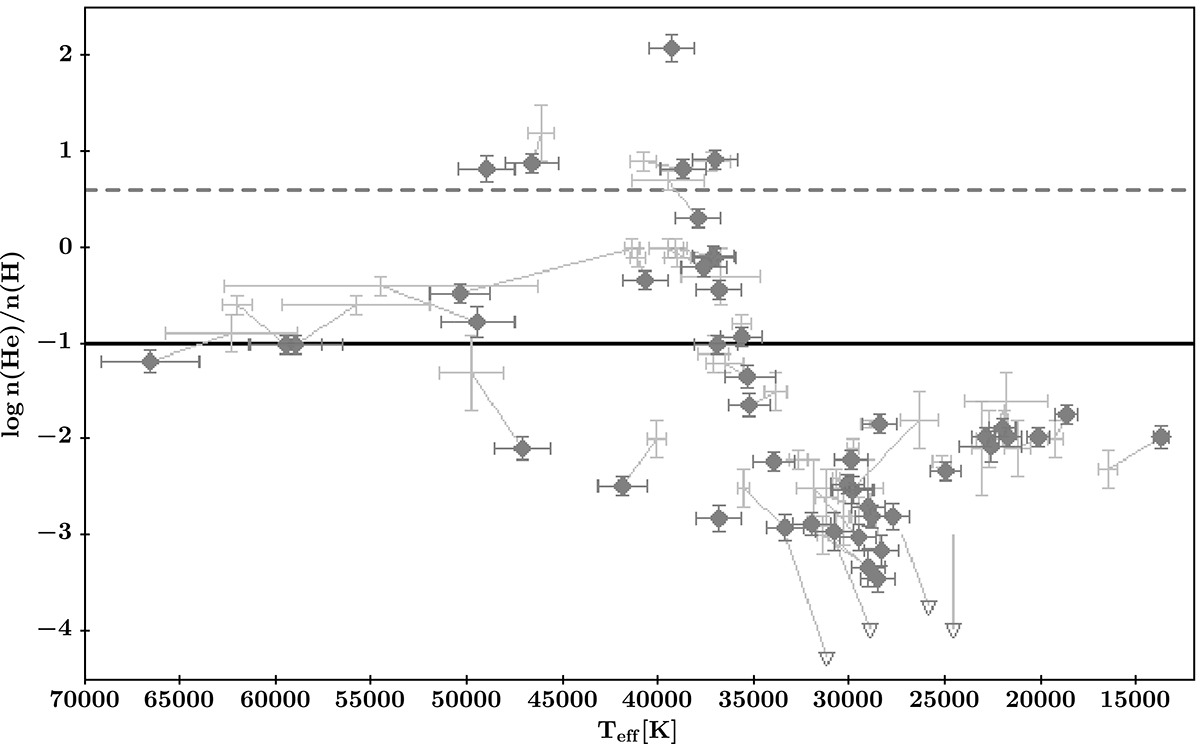
Teff − log n(He)/n(H) diagram of sample compared to the preliminary analysis (see Fig. 5). Solar helium abundance is marked by the solid horizontal line, while the dotted line marks the transition between intermediate and extreme helium abundance.
Current usage metrics show cumulative count of Article Views (full-text article views including HTML views, PDF and ePub downloads, according to the available data) and Abstracts Views on Vision4Press platform.
Data correspond to usage on the plateform after 2015. The current usage metrics is available 48-96 hours after online publication and is updated daily on week days.
Initial download of the metrics may take a while.