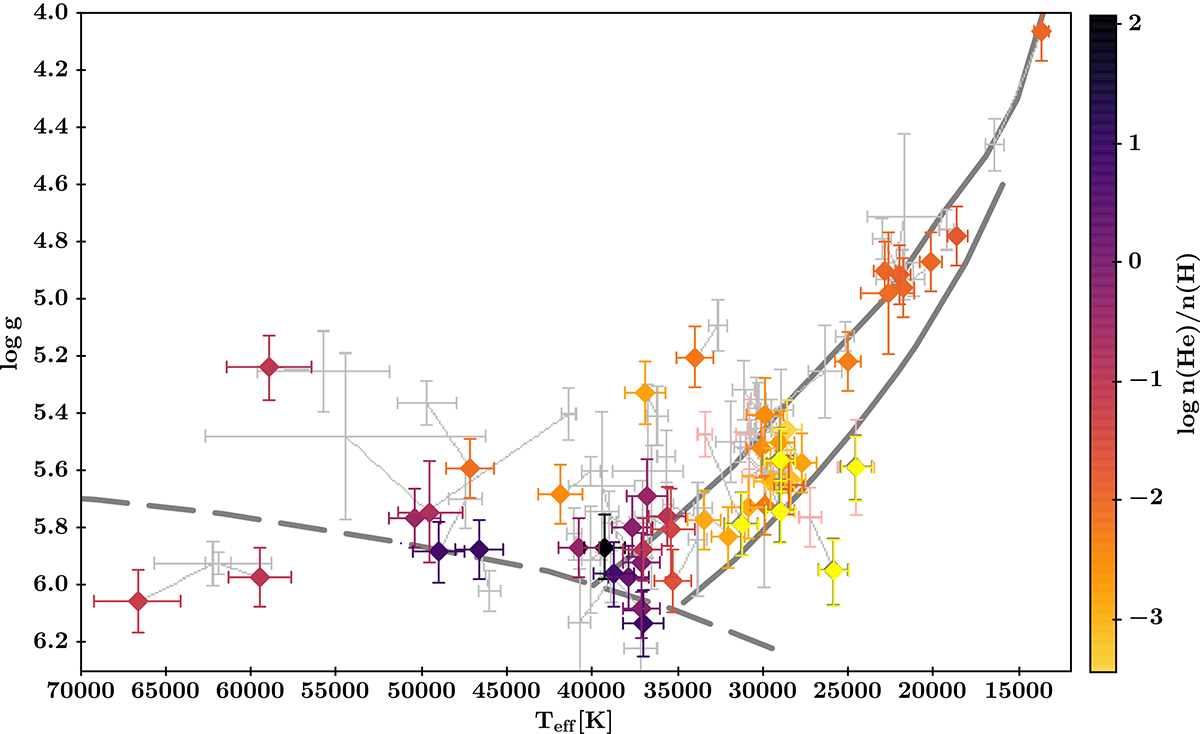
Fig. 5.
Download original image
Teff − log g diagram of sample of fast stars. The colour scales with the helium abundance from light orange to dark purple. The light grey symbols mark the results of the preliminary spectroscopic analysis on which the target selection was based. They are connected with the corresponding values from the new homogeneous analysis. The zero-age and terminal-age EHBs for a subsolar metallicity of −1.48 (solid grey lines) were interpolated from evolutionary tracks by Dorman et al. (1993). The helium main sequence (dashed line) is taken from Paczynski (1971).
Current usage metrics show cumulative count of Article Views (full-text article views including HTML views, PDF and ePub downloads, according to the available data) and Abstracts Views on Vision4Press platform.
Data correspond to usage on the plateform after 2015. The current usage metrics is available 48-96 hours after online publication and is updated daily on week days.
Initial download of the metrics may take a while.