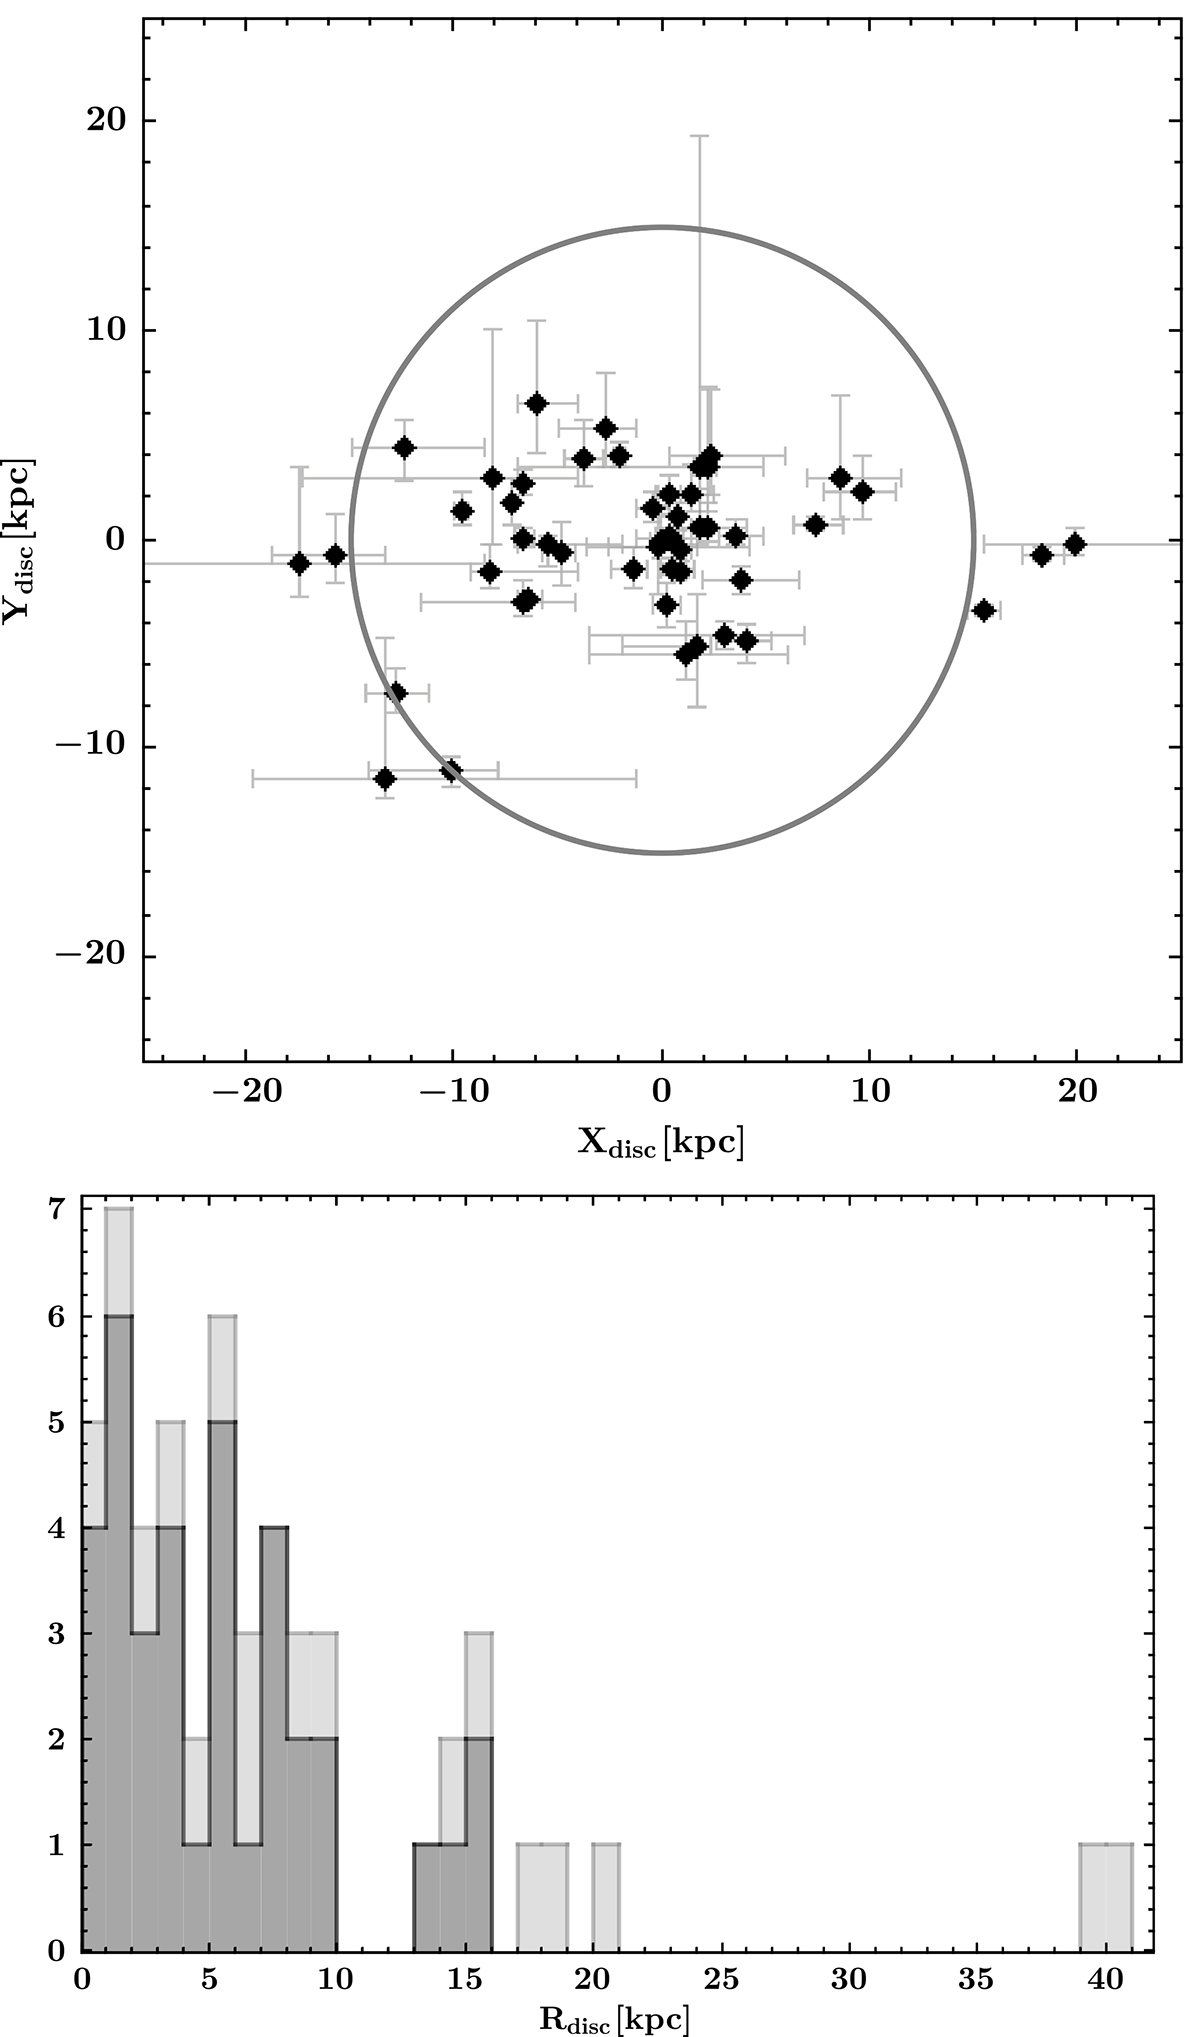
Fig. 11.
Download original image
Upper panel: Points of last Galactic disc crossings of stars in our sample in the X–Y plane. The two stars with the largest distances have been omitted here for better visualisation. Lower panel: Distribution of the galactocentric radii at disc crossing for all stars of the sample. Stars that could have been ejected from the disc are marked in dark grey, and the others are in light grey.
Current usage metrics show cumulative count of Article Views (full-text article views including HTML views, PDF and ePub downloads, according to the available data) and Abstracts Views on Vision4Press platform.
Data correspond to usage on the plateform after 2015. The current usage metrics is available 48-96 hours after online publication and is updated daily on week days.
Initial download of the metrics may take a while.