Fig. 10.
Download original image
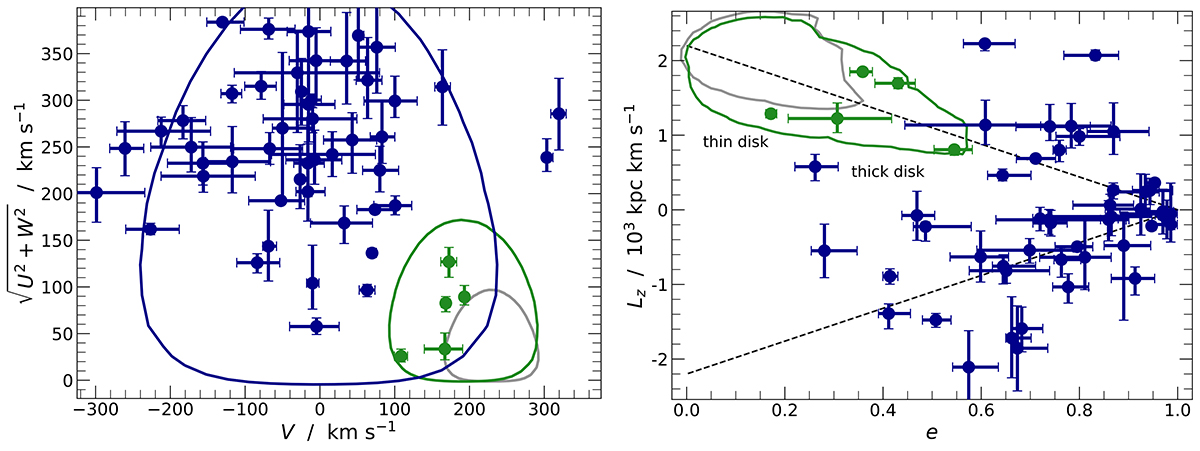
Left panel: Toomre diagram of sample. The 2σ contours of the thin disc (grey), the thick disc (green), and the halo (blue) are constructed from the U, V, and W distributions of Anguiano et al. (2020). Objects with halo kinematics are marked in blue; the few objects also consistent with thick-disc kinematics are marked in green. Right panel: e − LZ diagram of the sample using the same colour coding for the stars. The green and grey 2σ contours in the upper left denote the locations of thin- and thick-disc stars, respectively, based on the GALAH + Gaia EDR3 sample of Buder et al. (2021). The dashed lines mark prograde (positive LZ) and retrograde (negative LZ) directions of Galactic rotation, respectively.
Current usage metrics show cumulative count of Article Views (full-text article views including HTML views, PDF and ePub downloads, according to the available data) and Abstracts Views on Vision4Press platform.
Data correspond to usage on the plateform after 2015. The current usage metrics is available 48-96 hours after online publication and is updated daily on week days.
Initial download of the metrics may take a while.