Fig. 9
Download original image
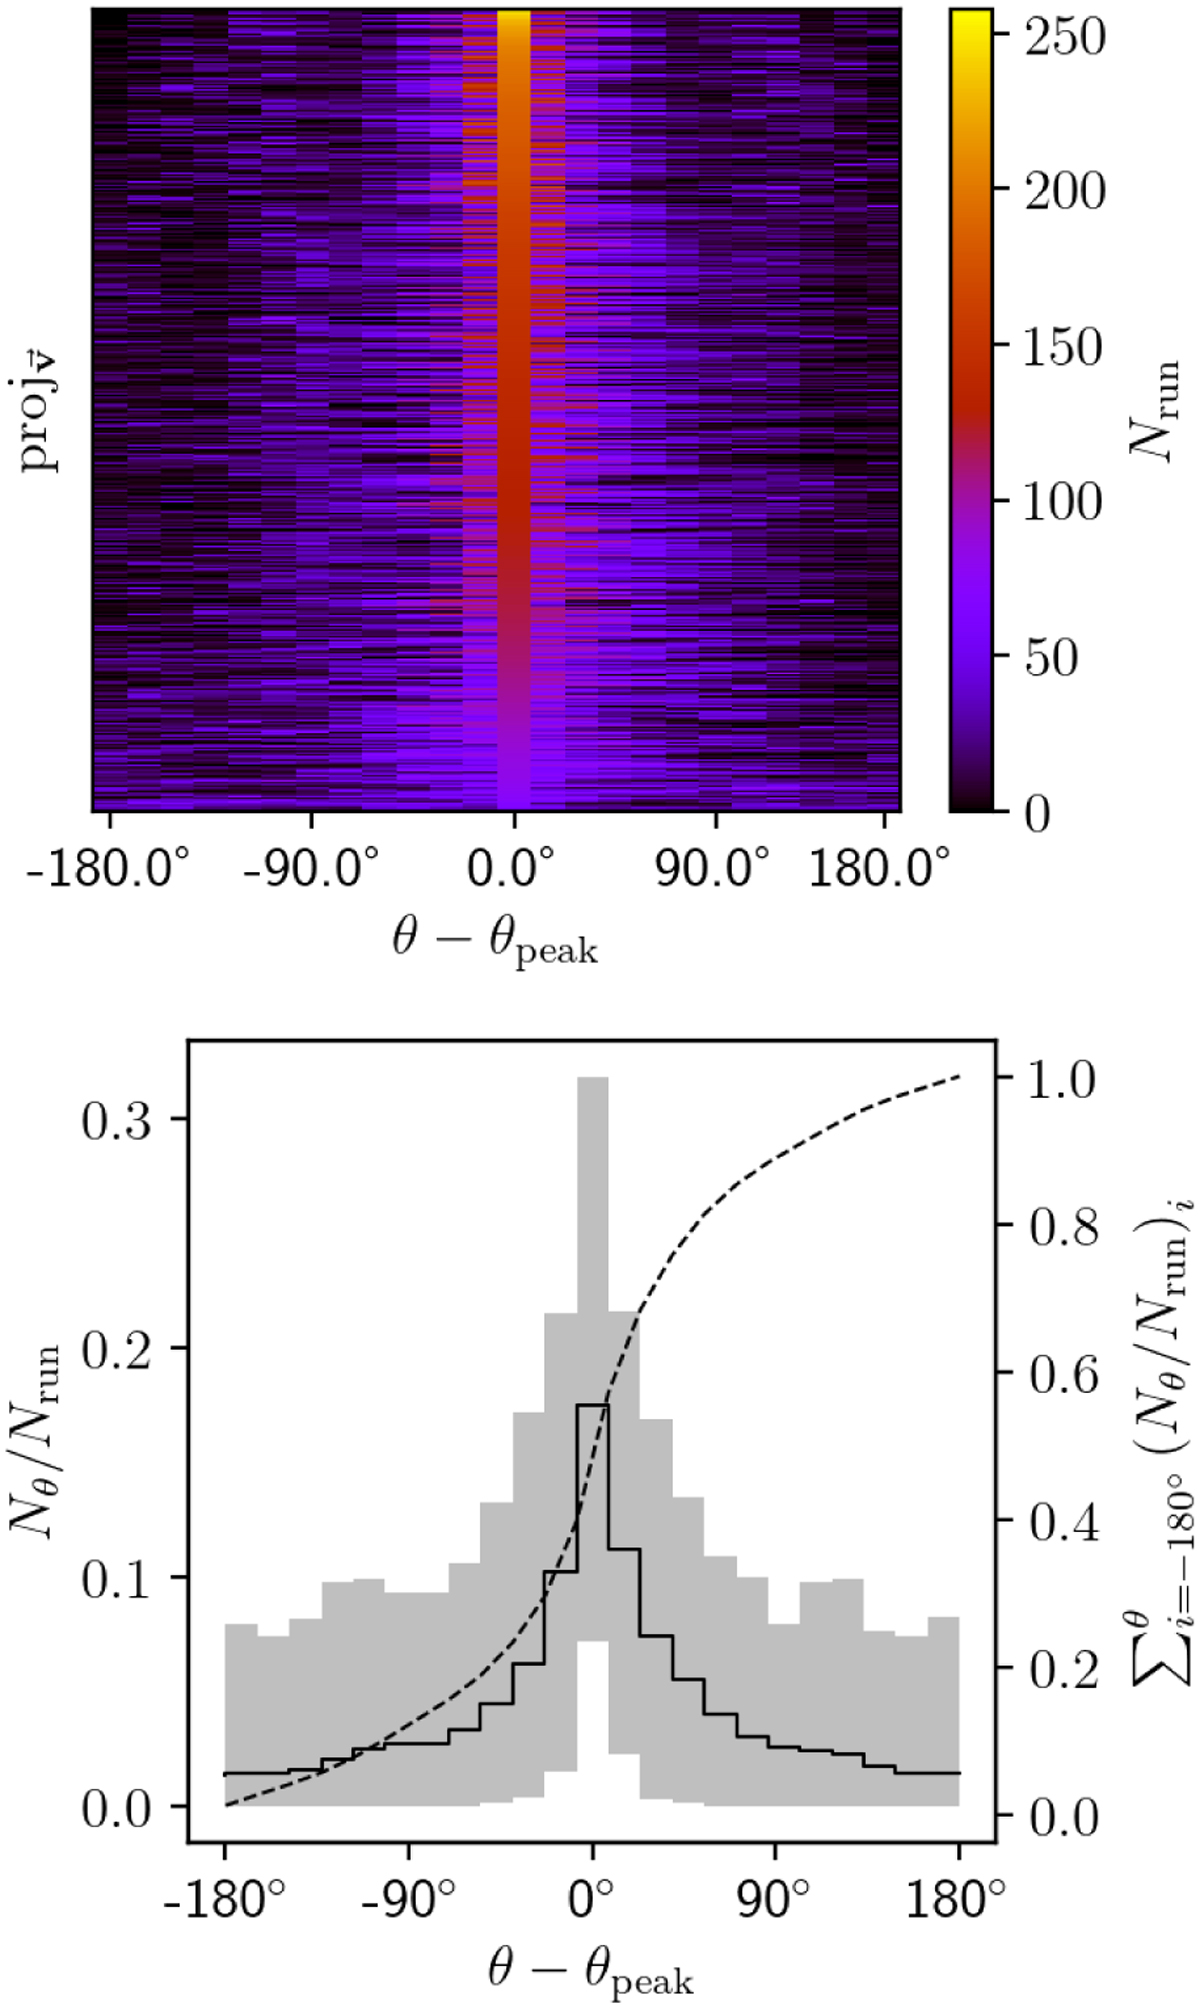
Histograms of runaway star directions from 1000 different projections. Top: 2D histogram showing the 1000 projections, sorted vertically and centered horizontally by peak number of runaway stars, Nrun, and wrapped around the x-axis. For every projection there is a strong peak. Looking at each row individually, a fainter peak can be seen to the right or left of the peak value. Bottom: average value of the projections (black histogram) and the range from maximum to minimum (gray area), with values given by the left axis. The dashed line shows the cumulative sum of the runaway stars per bin, with values given by the right axis.
Current usage metrics show cumulative count of Article Views (full-text article views including HTML views, PDF and ePub downloads, according to the available data) and Abstracts Views on Vision4Press platform.
Data correspond to usage on the plateform after 2015. The current usage metrics is available 48-96 hours after online publication and is updated daily on week days.
Initial download of the metrics may take a while.