Fig. 5
Download original image
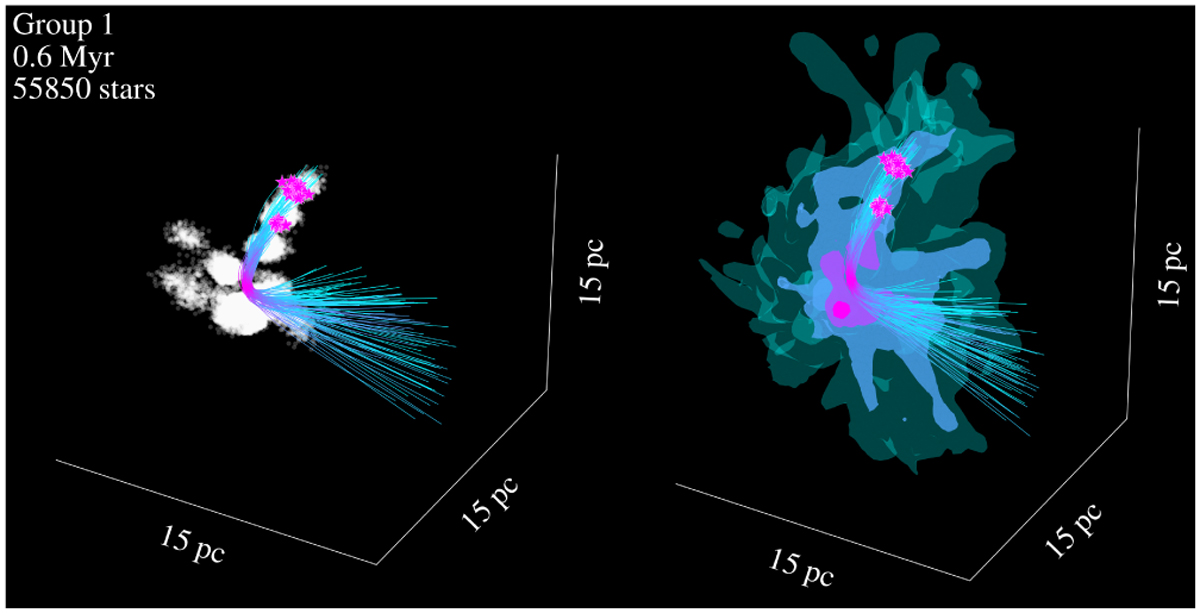
Movie of the formation and ejection of runaway star group 1. Left: stars as they are forming in the cluster. Right: gravitational potential of both the stars and gas. The trajectories of the runaway stars are shown as lines. Once each runaway star forms, it appears with a star marker. This plot shows the same variables as shown in Figs. 6 and 7.
Current usage metrics show cumulative count of Article Views (full-text article views including HTML views, PDF and ePub downloads, according to the available data) and Abstracts Views on Vision4Press platform.
Data correspond to usage on the plateform after 2015. The current usage metrics is available 48-96 hours after online publication and is updated daily on week days.
Initial download of the metrics may take a while.