Fig. 3

Download original image
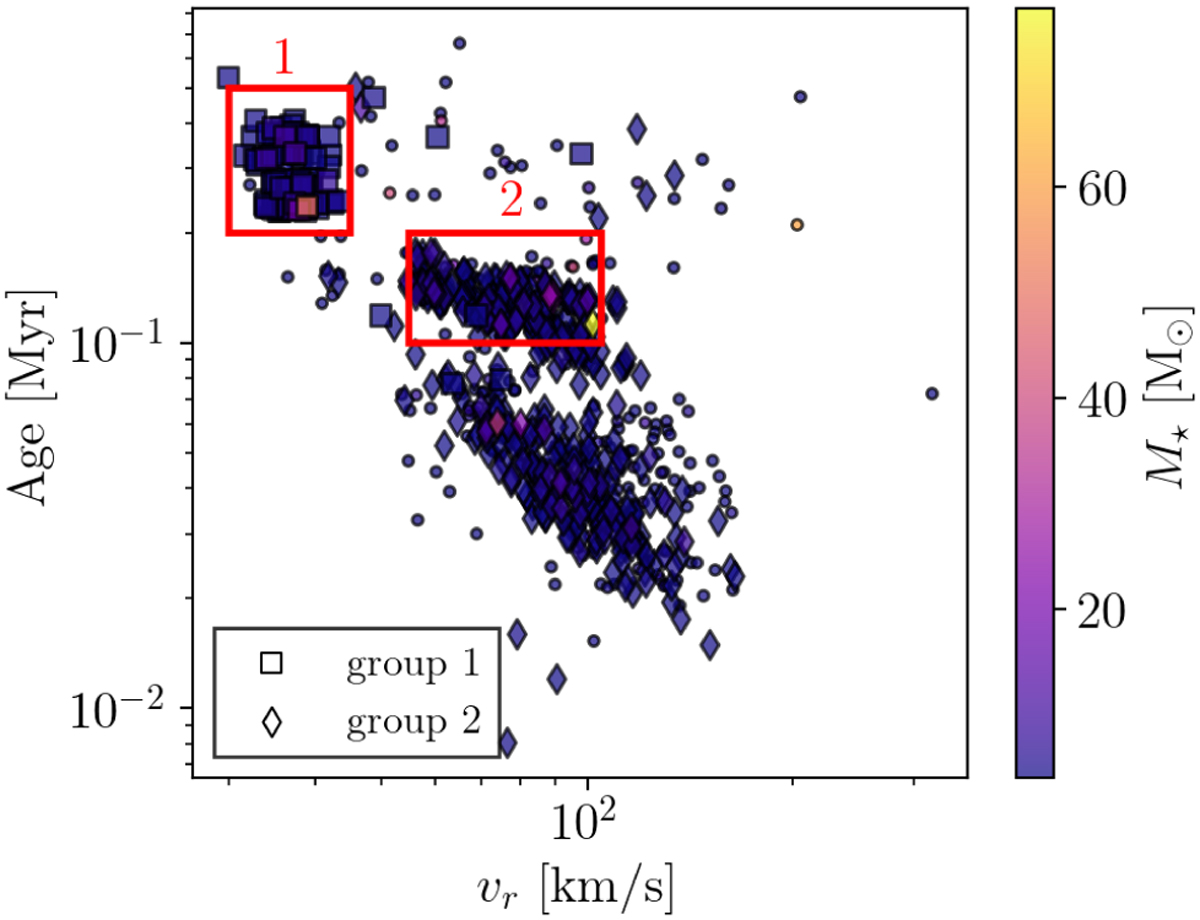
Scatter plot of the runaway stars, with the radial velocity and age colored by mass. Squares are group 1, diamonds are group 2, and dots are the rest of the runaways. These groups are the runaways selected by ejection direction only. The two groups are distinctly separate in both age and velocity. Group 2 contains two subgroups ejected in the same direction but at slightly different times. For the purpose of demonstrating the SCES mechanism, we focus on the later forming subgroup in group 2. The red rectangles indicate the additional filtering of the runaway groups by age and velocity.
Current usage metrics show cumulative count of Article Views (full-text article views including HTML views, PDF and ePub downloads, according to the available data) and Abstracts Views on Vision4Press platform.
Data correspond to usage on the plateform after 2015. The current usage metrics is available 48-96 hours after online publication and is updated daily on week days.
Initial download of the metrics may take a while.


