Open Access
Fig. 2
Download original image
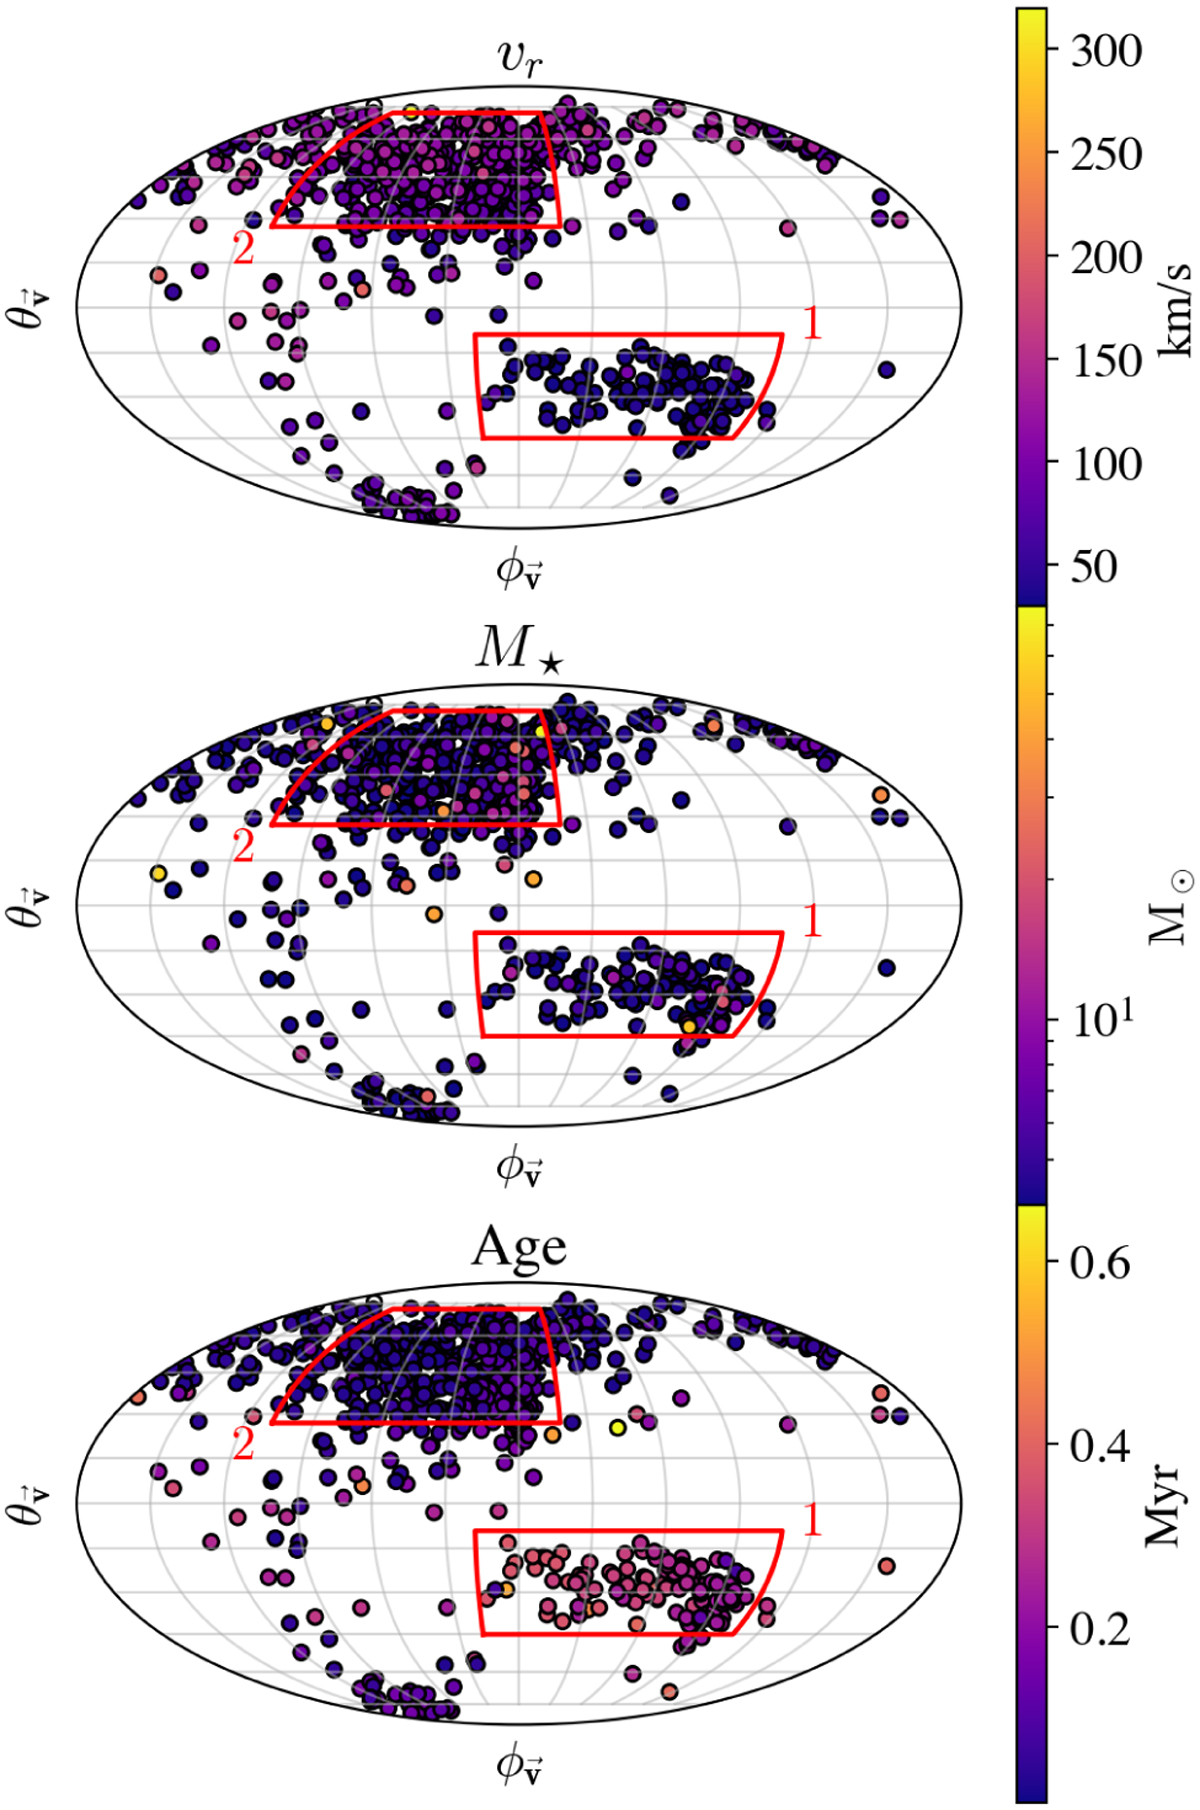
Mollweide map projection of the ejection directions of the runaway stars in M6. The colors correspond to the radial velocity from the cluster center of mass (top), the star mass (middle), and the star age (bottom). The highest values are plotted over lower values for visibility.
Current usage metrics show cumulative count of Article Views (full-text article views including HTML views, PDF and ePub downloads, according to the available data) and Abstracts Views on Vision4Press platform.
Data correspond to usage on the plateform after 2015. The current usage metrics is available 48-96 hours after online publication and is updated daily on week days.
Initial download of the metrics may take a while.