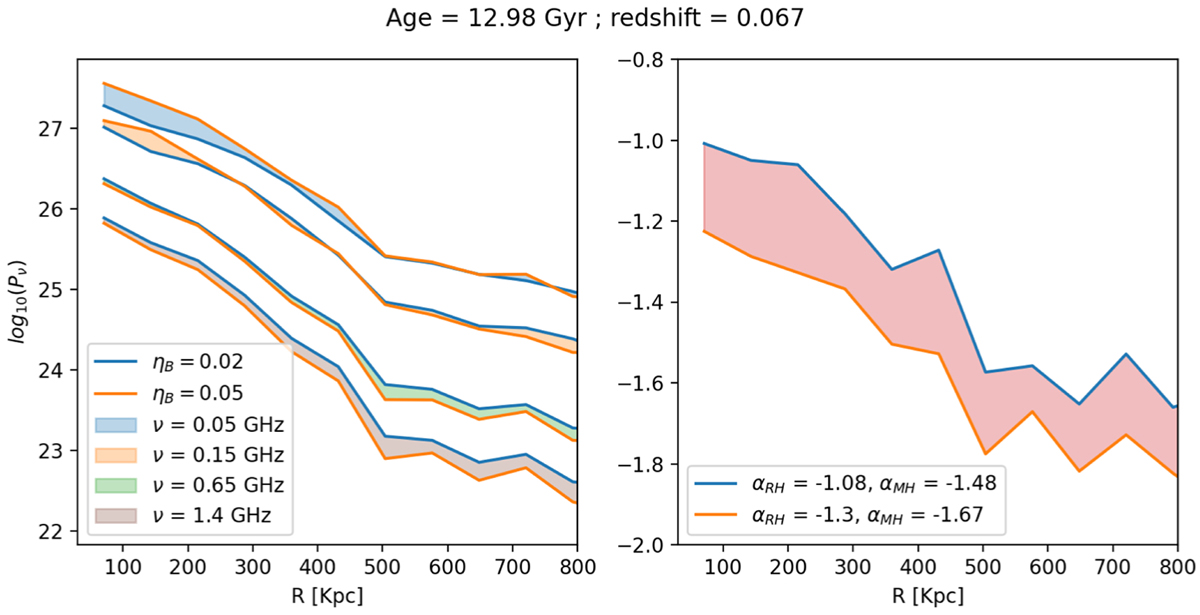
Fig. 8
Download original image
Radial profile of the radio power with all the frequencies and spectral index radial distribution. Both plots show the profiles computed with two different magnetic field strengths: one with ηB = 0.02 (blue line) and the other with ηB = 0.05 (orange line). The filled region represents all the intermediate values that the magnetic field can assume. The right panel also shows the values of the spectral index in the two regions of MegaRH and ClassicalRH.
Current usage metrics show cumulative count of Article Views (full-text article views including HTML views, PDF and ePub downloads, according to the available data) and Abstracts Views on Vision4Press platform.
Data correspond to usage on the plateform after 2015. The current usage metrics is available 48-96 hours after online publication and is updated daily on week days.
Initial download of the metrics may take a while.