Open Access
Fig. 6
Download original image
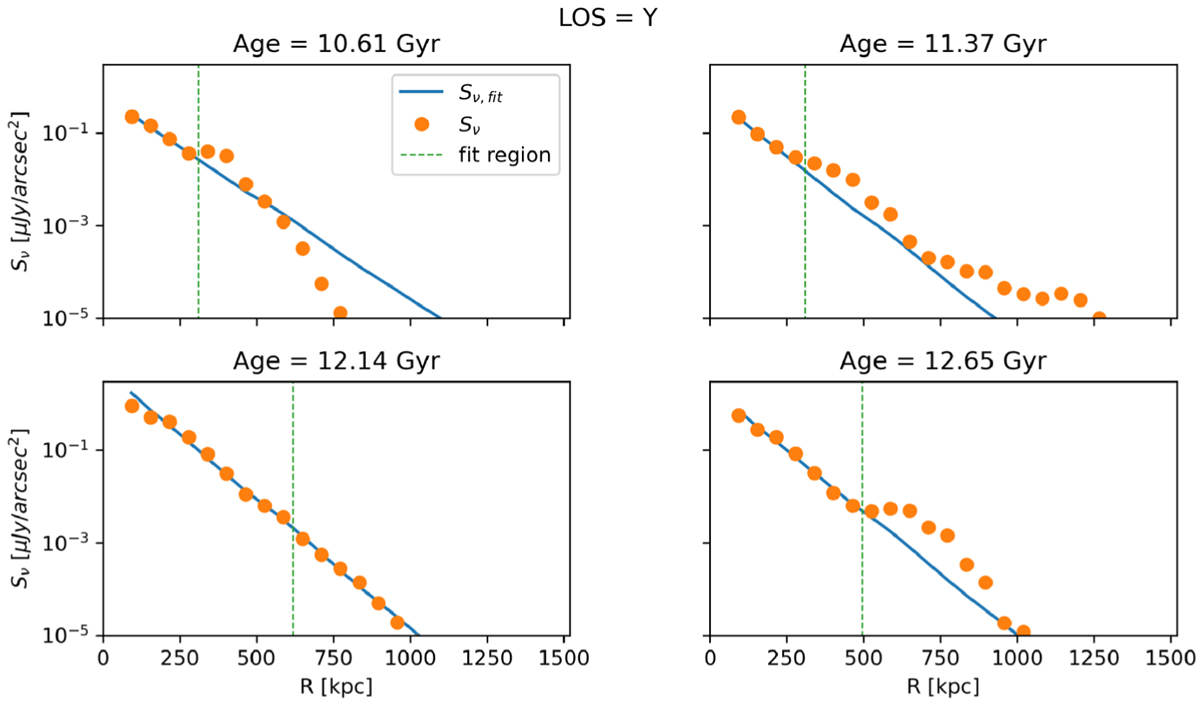
Radial profiles of the cluster at four different epochs along the Y line of sight. The region used for the fit where selected as in Cuciti et al. (2022) and in the figures it is find between the centre and the vertical dashed line.
Current usage metrics show cumulative count of Article Views (full-text article views including HTML views, PDF and ePub downloads, according to the available data) and Abstracts Views on Vision4Press platform.
Data correspond to usage on the plateform after 2015. The current usage metrics is available 48-96 hours after online publication and is updated daily on week days.
Initial download of the metrics may take a while.