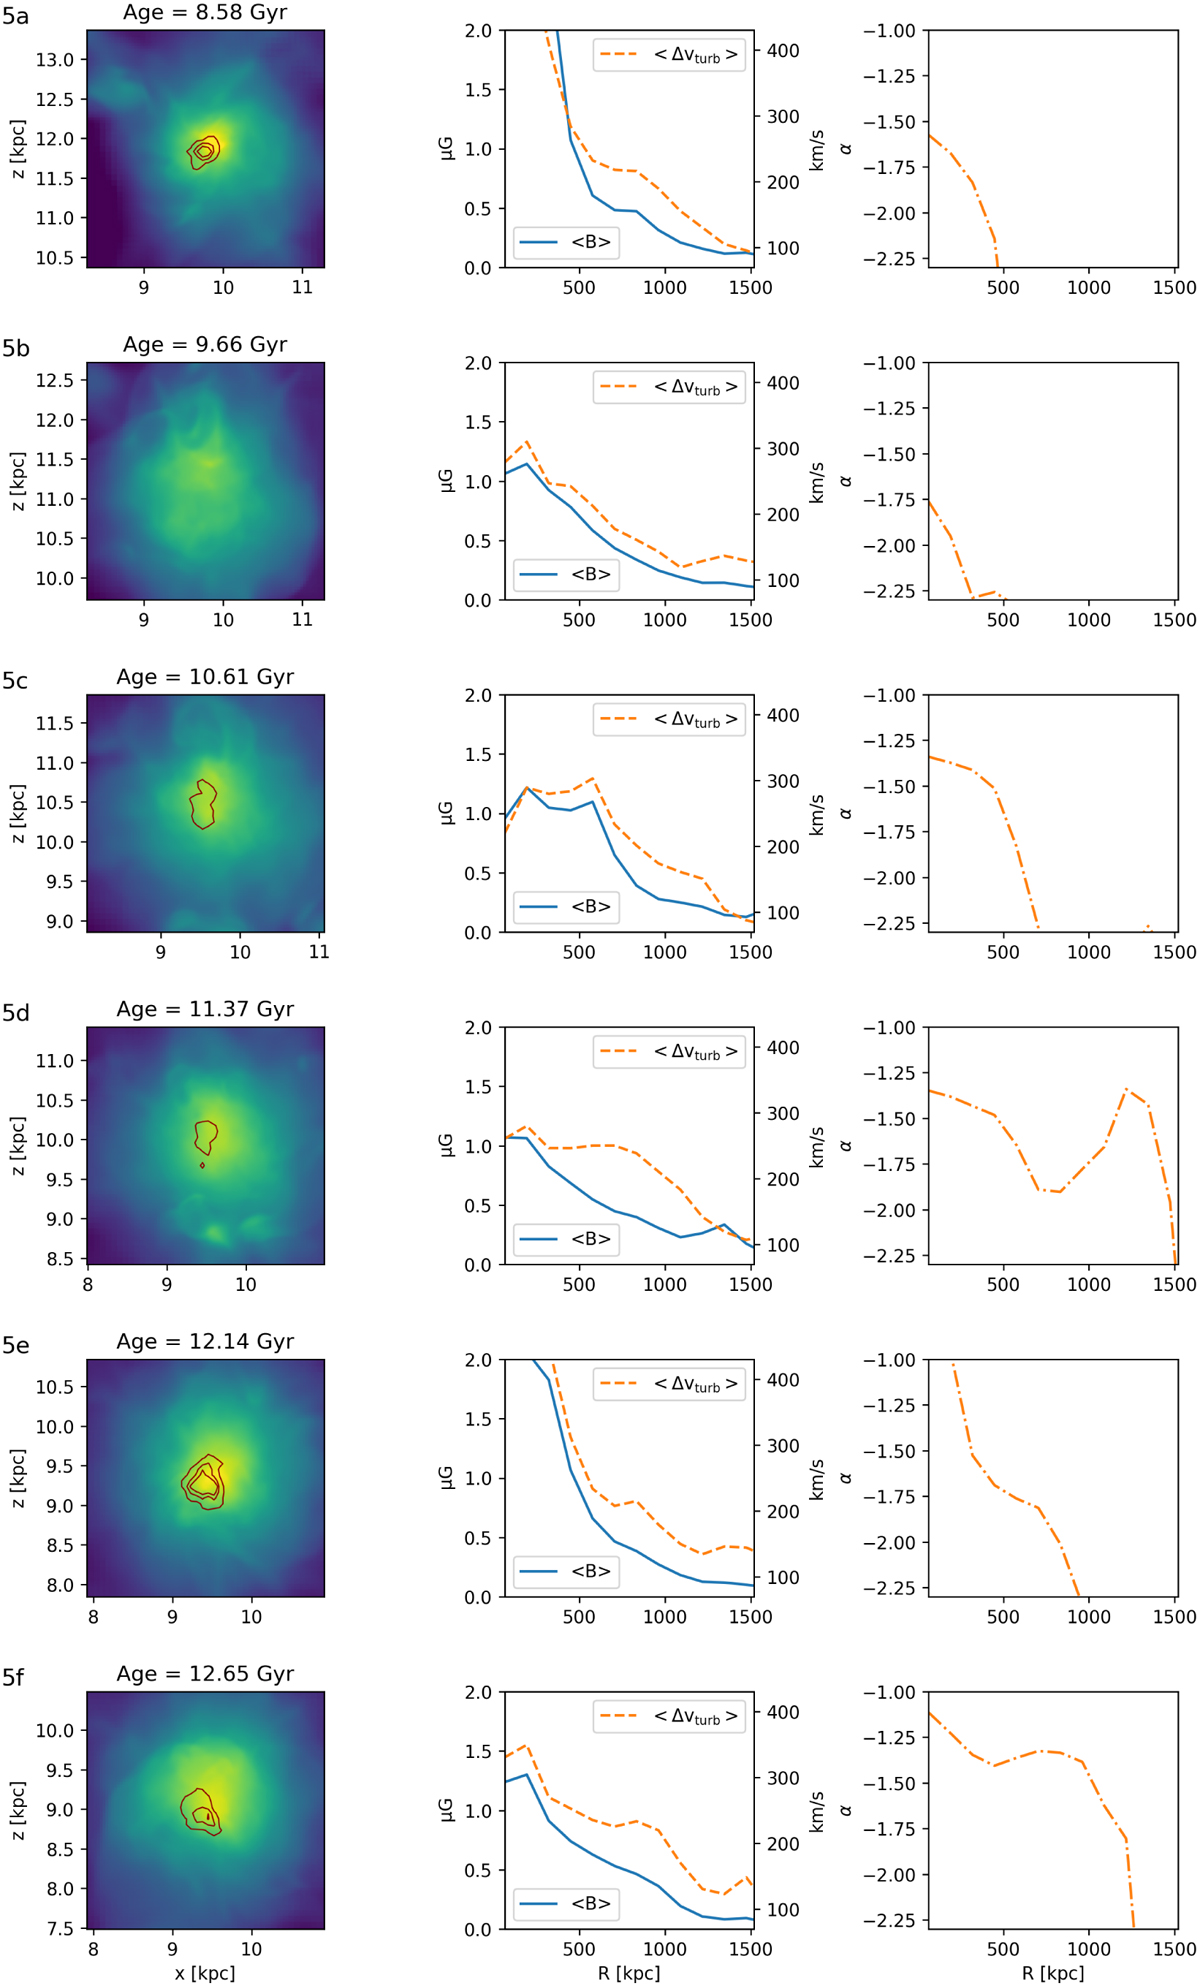
Fig. 5
Download original image
Each row shows the map of density and synchrotron emission, the magnetic field strength, and the turbulent velocity, both averaged over an annulus of 128 kpc, and the radially averaged spectral index. All the quantities are taken over the projection along the y-axis. The contours represent the radio power at P150 MHz = {1027, 5 · 1027, 1028} (erg/s/Hz/pixel), where the size of each pixel is 39”, assuming the cluster is always observed at zobs = 0.095.
Current usage metrics show cumulative count of Article Views (full-text article views including HTML views, PDF and ePub downloads, according to the available data) and Abstracts Views on Vision4Press platform.
Data correspond to usage on the plateform after 2015. The current usage metrics is available 48-96 hours after online publication and is updated daily on week days.
Initial download of the metrics may take a while.