Fig. 4
Download original image
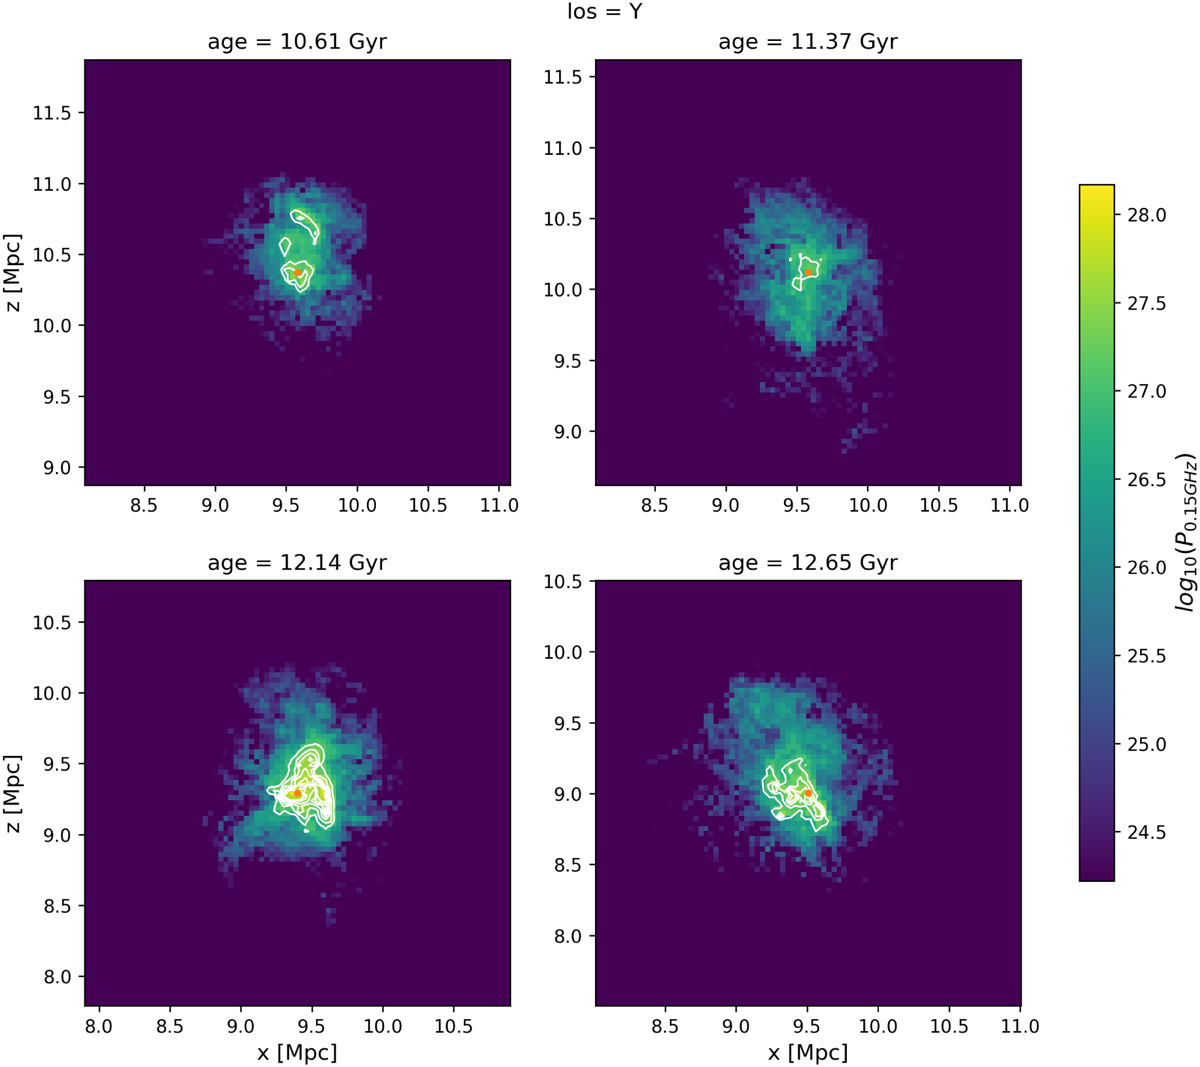
Synchrotron radio emission maps at 150 MHz for four epochs already considered in previous plots, in units of [erg/s/Hz/pixel], where the size of each pixel is 39″. The peak in each map is marked by the orange dot and is the centre used to compute the radial emission profiles, while the white contours represent the noise levels at the different levels of σrms.
Current usage metrics show cumulative count of Article Views (full-text article views including HTML views, PDF and ePub downloads, according to the available data) and Abstracts Views on Vision4Press platform.
Data correspond to usage on the plateform after 2015. The current usage metrics is available 48-96 hours after online publication and is updated daily on week days.
Initial download of the metrics may take a while.