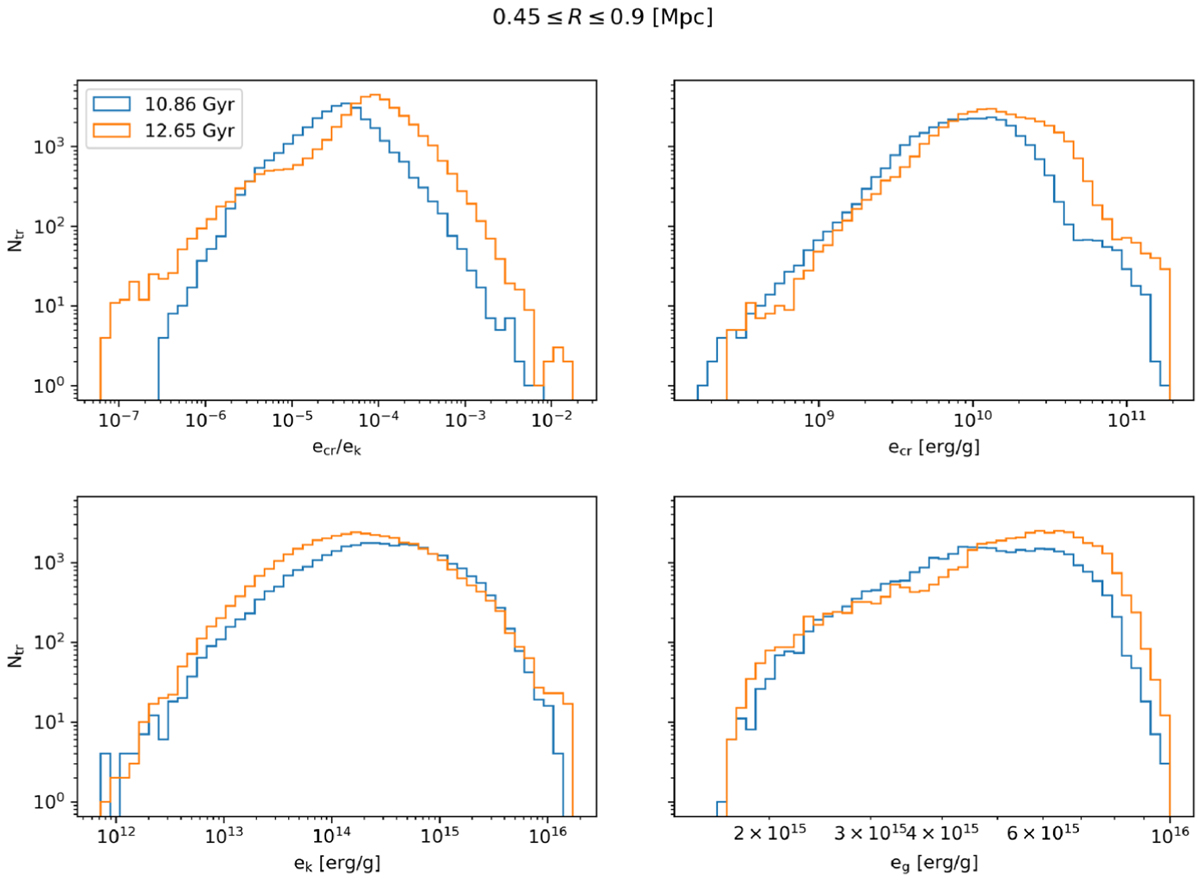
Fig. 3
Download original image
Energy distributions of the tracers inside R500 at two different redshifts, marking an epoch before (10.86 Gyr) and after (12.65 Gyr) the last important merger in the system, and the onset of diffuse radio emission. Top-left: distribution of the ratio between the CR energy and the turbulent energy. The ratio increases with time and broadens after the merger; top-right: distribution of the CRe energy; bottom-left: kinetic, or turbulent, energy distribution; bottom-right: the gas energy distribution.
Current usage metrics show cumulative count of Article Views (full-text article views including HTML views, PDF and ePub downloads, according to the available data) and Abstracts Views on Vision4Press platform.
Data correspond to usage on the plateform after 2015. The current usage metrics is available 48-96 hours after online publication and is updated daily on week days.
Initial download of the metrics may take a while.