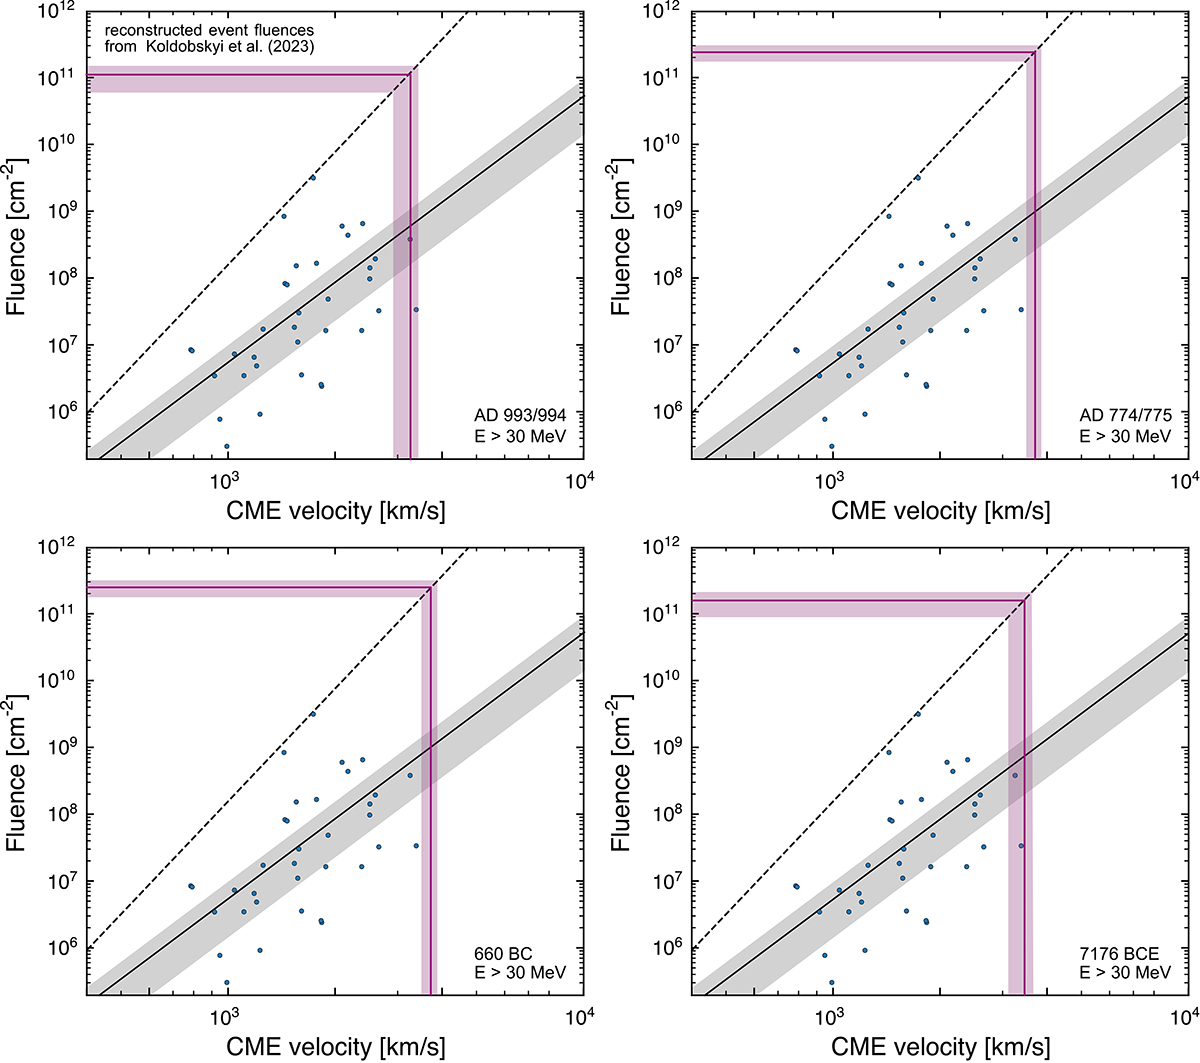
Fig. 4.
Download original image
FP-VCME relations for E > 30 MeV. The magenta ribbons on the Y-axis correspond to the FP range for AD993, AD774/775, 7176 BCE, and 660 BCE (in the clockwise direction) as published by Koldobskiy et al. (2023). The ribbons on the X-axis show the estimated VCME range for the events based on the RMA fit (solid black line) and the upper limit (worst-case scenario; dashed black lines).
Current usage metrics show cumulative count of Article Views (full-text article views including HTML views, PDF and ePub downloads, according to the available data) and Abstracts Views on Vision4Press platform.
Data correspond to usage on the plateform after 2015. The current usage metrics is available 48-96 hours after online publication and is updated daily on week days.
Initial download of the metrics may take a while.