Fig. 3.
Download original image
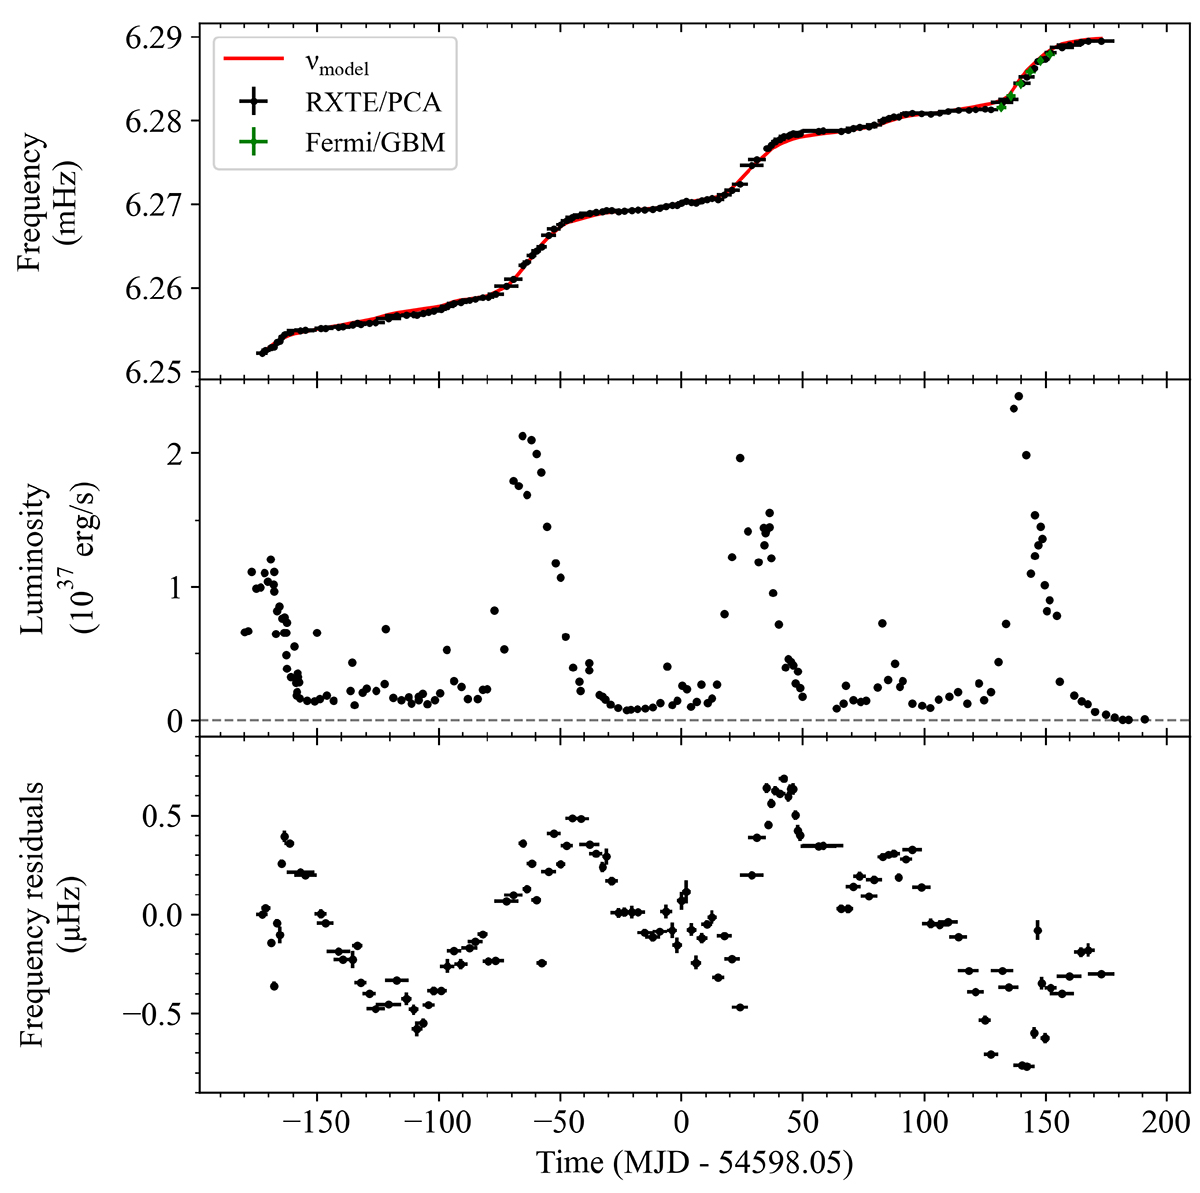
Frequency measurements of MXB 0656–072 with RXTE/PCA (black) and Fermi/GBM (green) shown at the top. The solid red line represents the intrinsic spin frequency model obtained through the ![]() –L relation. Middle panel: 3–20 keV RXTE/PCA flux evolution. Lower panel: spin frequency residuals after subtracting νmodel from the frequency measurements.
–L relation. Middle panel: 3–20 keV RXTE/PCA flux evolution. Lower panel: spin frequency residuals after subtracting νmodel from the frequency measurements.
Current usage metrics show cumulative count of Article Views (full-text article views including HTML views, PDF and ePub downloads, according to the available data) and Abstracts Views on Vision4Press platform.
Data correspond to usage on the plateform after 2015. The current usage metrics is available 48-96 hours after online publication and is updated daily on week days.
Initial download of the metrics may take a while.