Fig. 8.
Download original image
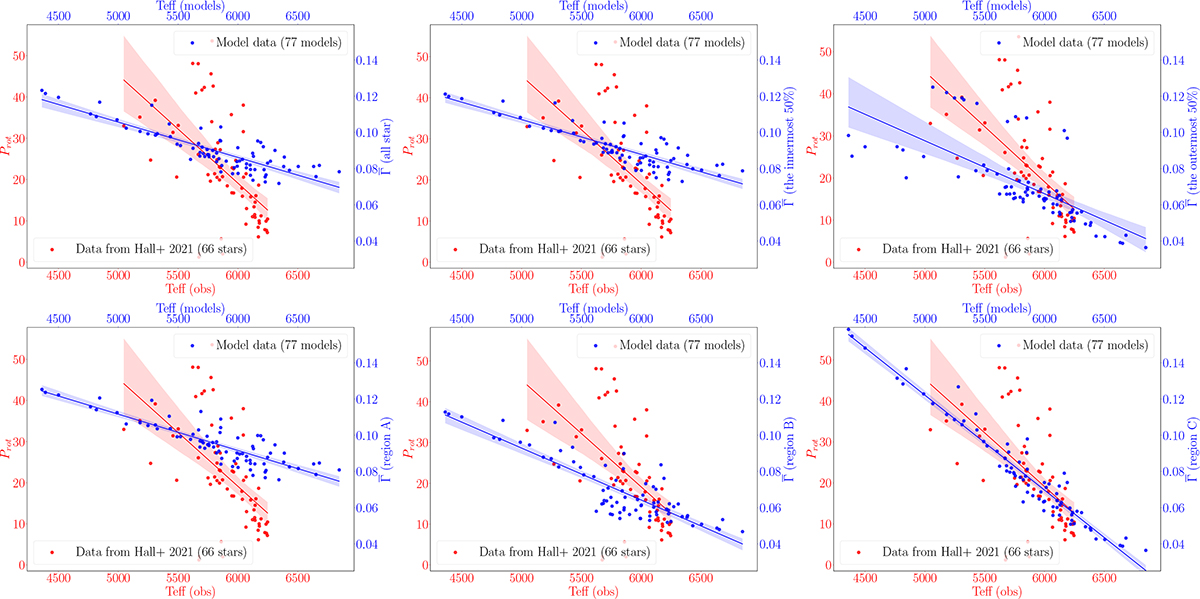
Rotation periods as a function of effective temperature for a group of 66 low-mass MS stars in the Kepler field (the same stars that are represented in Figure 1 with red color, and that serve as references for the theoretical models). Red circles represent observational data. Blue circles represent theoretical data. Specifically, they denote the ![]() values computed for different regions within the star, as indicated on the right y-axis of each subplot. Also plotted in this figure is a linear regression model fit to each set of data. The shaded area around the regression line represents a 95% confidence interval for the regression estimate.
values computed for different regions within the star, as indicated on the right y-axis of each subplot. Also plotted in this figure is a linear regression model fit to each set of data. The shaded area around the regression line represents a 95% confidence interval for the regression estimate.
Current usage metrics show cumulative count of Article Views (full-text article views including HTML views, PDF and ePub downloads, according to the available data) and Abstracts Views on Vision4Press platform.
Data correspond to usage on the plateform after 2015. The current usage metrics is available 48-96 hours after online publication and is updated daily on week days.
Initial download of the metrics may take a while.