Fig. 6.
Download original image
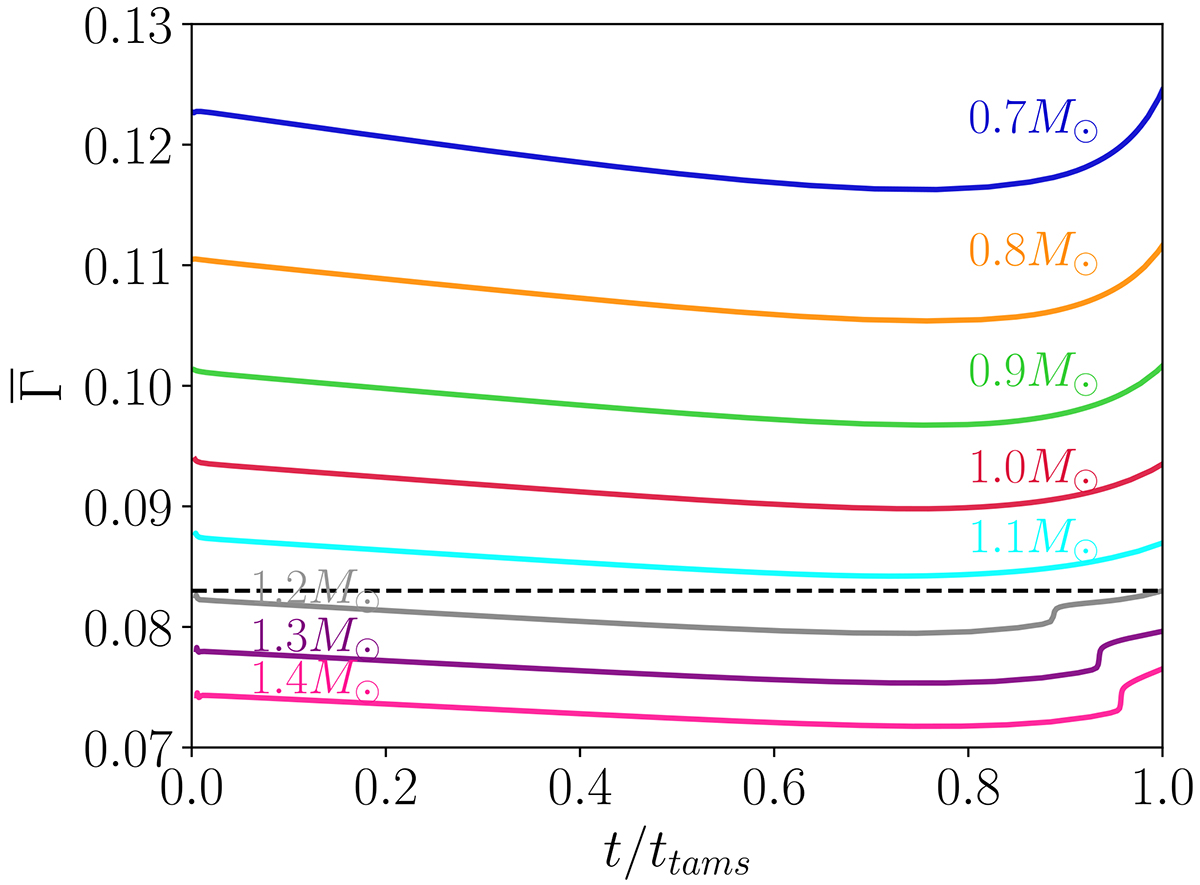
Variation of the global plasma parameter, ![]() , as a function of the normalized age for stellar models with different masses. All the models represented in this figure were computed with Z = 0.02. Lower-mass stellar models exhibit higher values of the global plasma parameter throughout the MS lifetime. The dashed black line represents the approximate location of the Kraft break.
, as a function of the normalized age for stellar models with different masses. All the models represented in this figure were computed with Z = 0.02. Lower-mass stellar models exhibit higher values of the global plasma parameter throughout the MS lifetime. The dashed black line represents the approximate location of the Kraft break.
Current usage metrics show cumulative count of Article Views (full-text article views including HTML views, PDF and ePub downloads, according to the available data) and Abstracts Views on Vision4Press platform.
Data correspond to usage on the plateform after 2015. The current usage metrics is available 48-96 hours after online publication and is updated daily on week days.
Initial download of the metrics may take a while.