Fig. 4.
Download original image
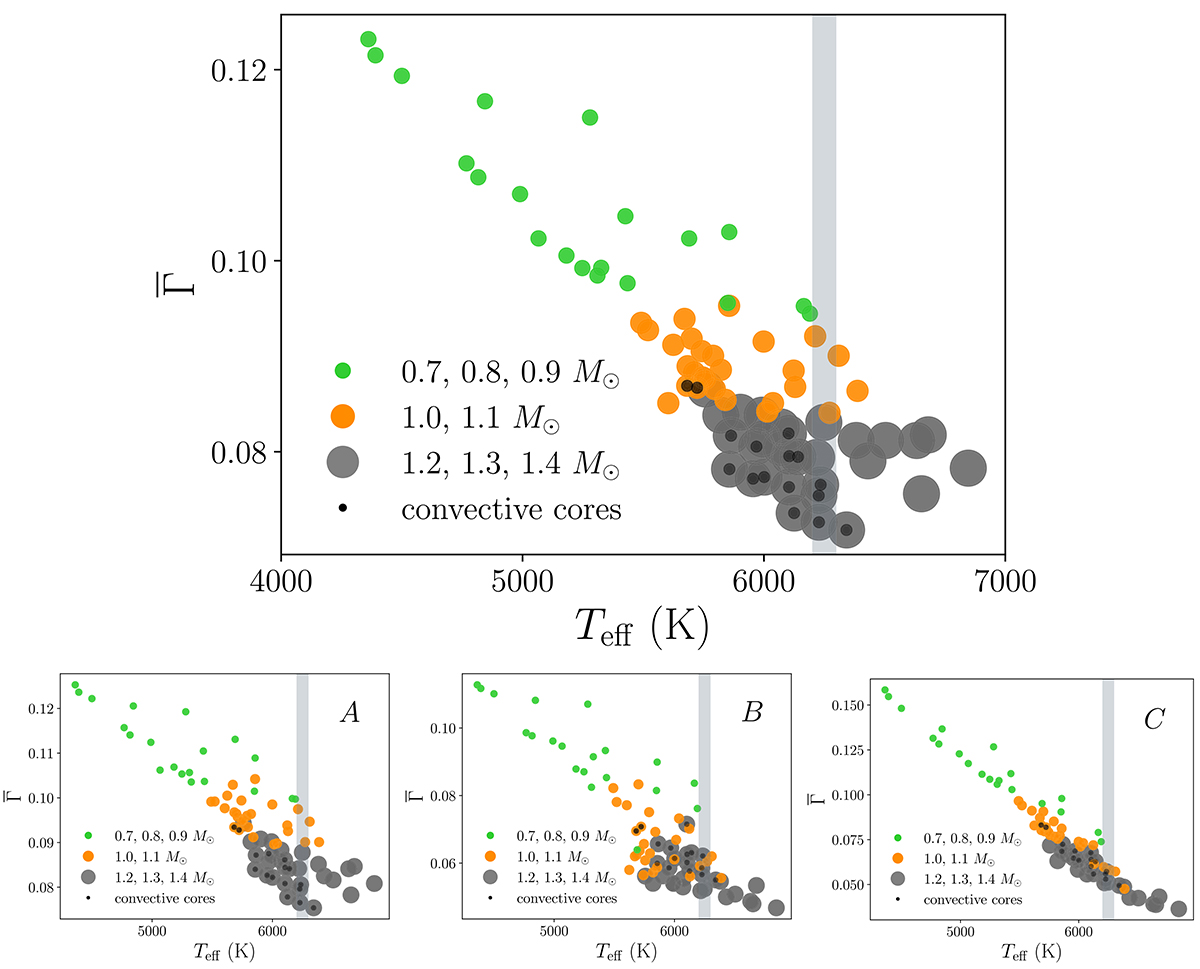
Value of ![]() as a function of the effective temperature for all the stellar models. Upper panel: Value of
as a function of the effective temperature for all the stellar models. Upper panel: Value of ![]() computed throughout the entire stellar interior. The green color highlights the less massive models (0.7, 0.8, and 0.9 M⊙), whereas the gray color highlights the more massive models (1.2, 1.3, and 1.4 M⊙). The orange color corresponds to models with 1.0 or 1.1 M⊙. The vertical dashed line indicates the approximate location of the Kraft break. Lower panel: Value of
computed throughout the entire stellar interior. The green color highlights the less massive models (0.7, 0.8, and 0.9 M⊙), whereas the gray color highlights the more massive models (1.2, 1.3, and 1.4 M⊙). The orange color corresponds to models with 1.0 or 1.1 M⊙. The vertical dashed line indicates the approximate location of the Kraft break. Lower panel: Value of ![]() computed for three different regions (A, B, and C) within the stellar interiors. Here, we show the computed values as a function of the effective temperature for all stellar models. Regions A, B, and C are described in Figure 3. The green, gray, and orange colors have the same meaning as in the upper panel. The small black circles in all the plots indicate the presence of a model with a convective core.
computed for three different regions (A, B, and C) within the stellar interiors. Here, we show the computed values as a function of the effective temperature for all stellar models. Regions A, B, and C are described in Figure 3. The green, gray, and orange colors have the same meaning as in the upper panel. The small black circles in all the plots indicate the presence of a model with a convective core.
Current usage metrics show cumulative count of Article Views (full-text article views including HTML views, PDF and ePub downloads, according to the available data) and Abstracts Views on Vision4Press platform.
Data correspond to usage on the plateform after 2015. The current usage metrics is available 48-96 hours after online publication and is updated daily on week days.
Initial download of the metrics may take a while.