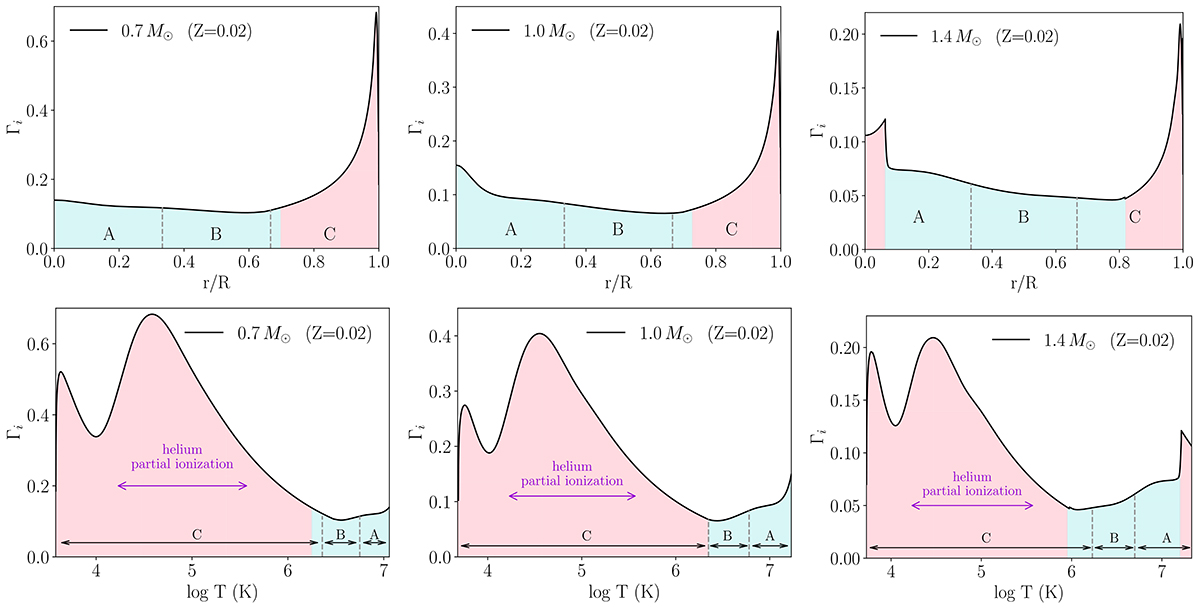
Fig. 3.
Download original image
Ionic plasma coupling parameter, Γi, illustrated for three models with varying masses at Z = 0.02. The upper panel shows Γi as a function of the fractional radius, while the lower panel shows Γi as a function of temperature (log T). Regions with higher values of Γi indicate a greater influence of electrostatic effects within the stellar interior. Across these three models, the significance of Coulomb effects is more pronounced in the outer stellar layers. The helium ionization zones are indicated with a purple double arrow, where the plasma coupling parameter reaches its maximum value. Additionally, three regions of equal length in radius are shown: Region A corresponds to the innermost third of the model, Region B to the central third, and Region C to the outermost third of the stellar interior. In all the plots, light blue regions correspond to radiative zones, and light red regions to convective regions. Finally, all three models in this figure are at IAMS, meaning they are in the middle of their evolutionary path on the MS.
Current usage metrics show cumulative count of Article Views (full-text article views including HTML views, PDF and ePub downloads, according to the available data) and Abstracts Views on Vision4Press platform.
Data correspond to usage on the plateform after 2015. The current usage metrics is available 48-96 hours after online publication and is updated daily on week days.
Initial download of the metrics may take a while.