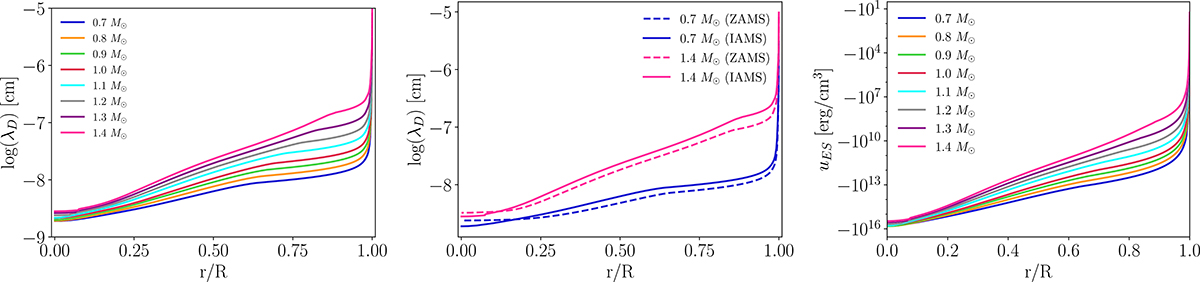
Fig. 2.
Download original image
Internal profiles of the Debye length as a function of the fractional radius. All models represented were computed with Z = 0.02. Left panel: Changes in the Debye length profiles for models with masses in the range 0.7 − 1.4 M⊙. Central panel: Debye length profiles for models with 0.7 and 1.4 M⊙ at two different stages of evolution: at the ZAMS and at midlife. Right panel: Internal profiles of the total energy density of electrostatic interactions as a function of the fractional radius. All the models in this figure are at the IAMS, meaning they are in the middle (intermediate age) of their evolutionary path on the main sequence.
Current usage metrics show cumulative count of Article Views (full-text article views including HTML views, PDF and ePub downloads, according to the available data) and Abstracts Views on Vision4Press platform.
Data correspond to usage on the plateform after 2015. The current usage metrics is available 48-96 hours after online publication and is updated daily on week days.
Initial download of the metrics may take a while.