Open Access
Fig. 7
Download original image
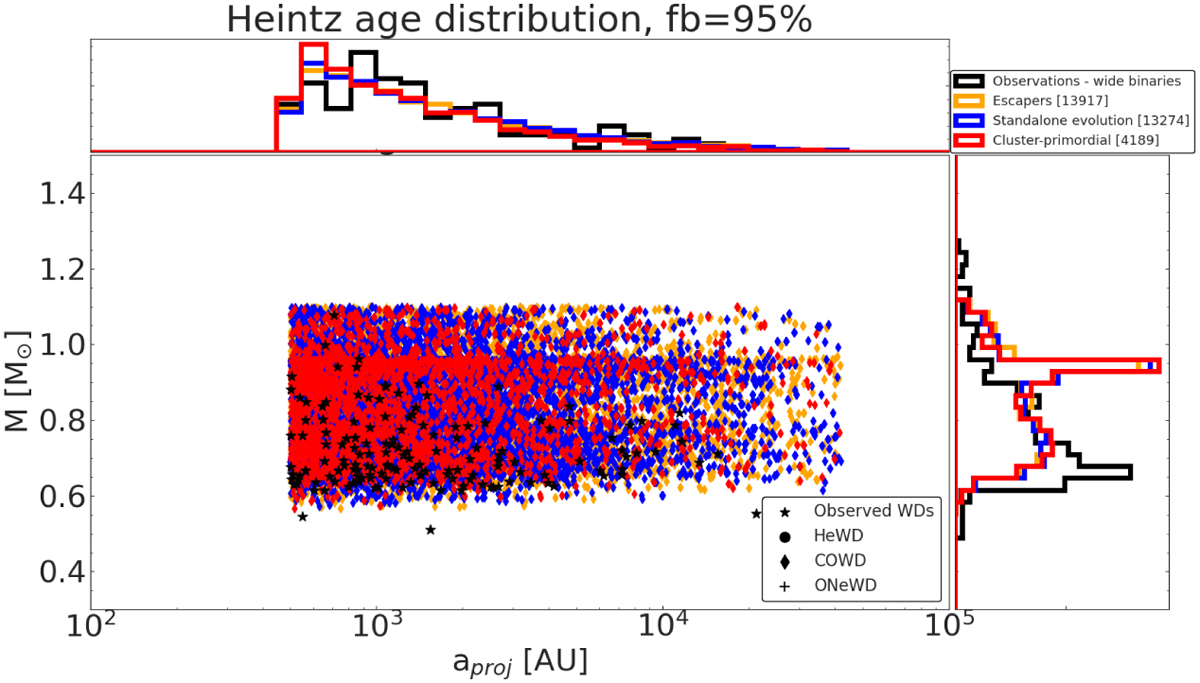
Projected separation plotted against mass of the WDs in the binary. In this figure we added an additional cutoff at 500 au to remove the tail of smaller separation binaries found in the observational data. We see good agreement in both mass and separation. See Fig. 1 for an explanation of colors and markers.
Current usage metrics show cumulative count of Article Views (full-text article views including HTML views, PDF and ePub downloads, according to the available data) and Abstracts Views on Vision4Press platform.
Data correspond to usage on the plateform after 2015. The current usage metrics is available 48-96 hours after online publication and is updated daily on week days.
Initial download of the metrics may take a while.