Fig. 7.
Download original image
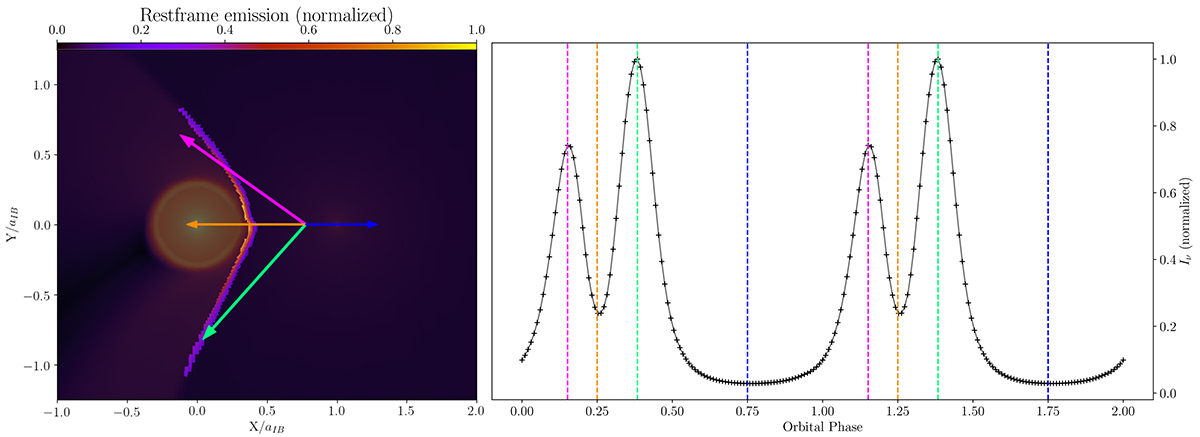
Left panel: Detected shocks cells for the pulsar radio state (b0) (also see Fig. 5), with the color scale representing the intensity of the rest-frame synchrotron emission normalized to its maximum value. Arrows indicate the lines of sight corresponding to the vectical lines with the same colors on the right panel. Right panel: Associated X-ray light curve. The orange and blue dashed lines correspond respectively to the star and pulsar inferior conjunctions (at 0.25 and 0.75 of the orbital phase). The vertical magenta and green dashed lines correspond to the angles with the maximum intensity received from the system.
Current usage metrics show cumulative count of Article Views (full-text article views including HTML views, PDF and ePub downloads, according to the available data) and Abstracts Views on Vision4Press platform.
Data correspond to usage on the plateform after 2015. The current usage metrics is available 48-96 hours after online publication and is updated daily on week days.
Initial download of the metrics may take a while.