Fig. 6.
Download original image
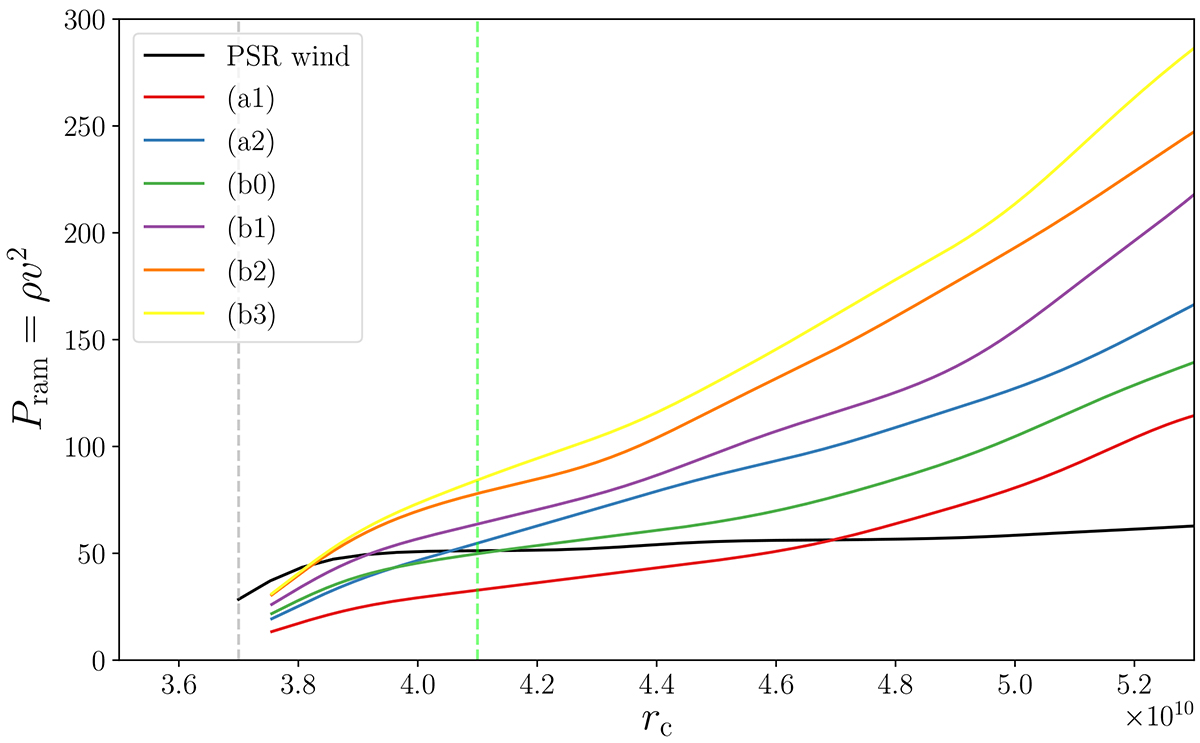
Evolution of the ram pressure as a function of the distance from the companion star. The colored curves correspond to the accretion stream (for simulations without a pulsar wind), while the black curve corresponds to the pulsar wind.The critical radius rt, crit is shown here with the vertical green line. The vertical gray line indicates the position of L1.
Current usage metrics show cumulative count of Article Views (full-text article views including HTML views, PDF and ePub downloads, according to the available data) and Abstracts Views on Vision4Press platform.
Data correspond to usage on the plateform after 2015. The current usage metrics is available 48-96 hours after online publication and is updated daily on week days.
Initial download of the metrics may take a while.