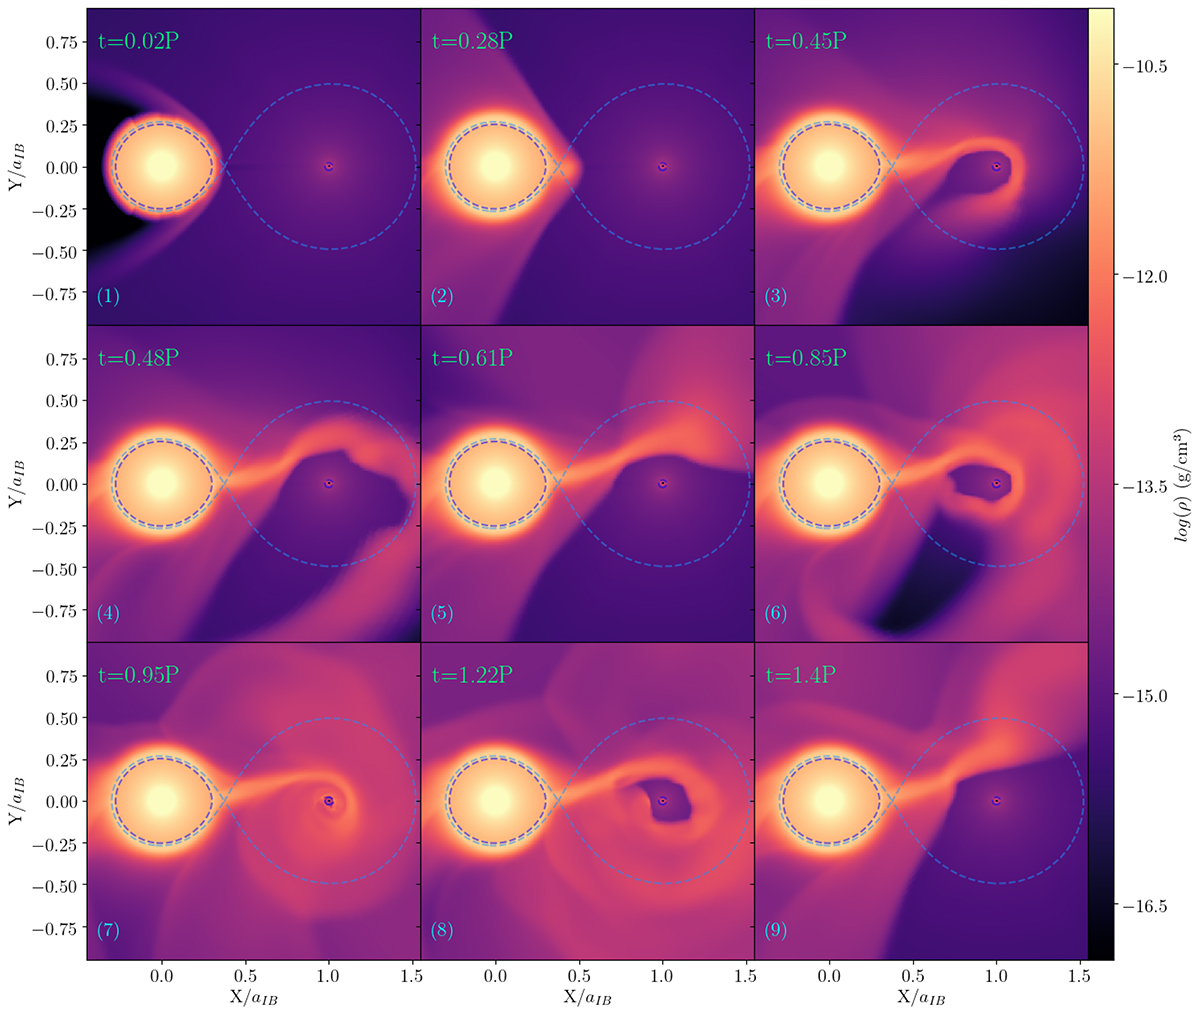
Fig. 4.
Download original image
Visualization of the interaction between the accretion stream and pulsar wind for the case (b1). Left is the companion and right is the NS. Purple dashed lines indicate boundary surfaces, while the blue dashed line indicates the isocontour of the effective gravitational potential through the L1 Lagrange point. The color scale gives matter density. Green text top left indicates the time in unit of orbital period, P.
Current usage metrics show cumulative count of Article Views (full-text article views including HTML views, PDF and ePub downloads, according to the available data) and Abstracts Views on Vision4Press platform.
Data correspond to usage on the plateform after 2015. The current usage metrics is available 48-96 hours after online publication and is updated daily on week days.
Initial download of the metrics may take a while.