Fig. 7
Download original image
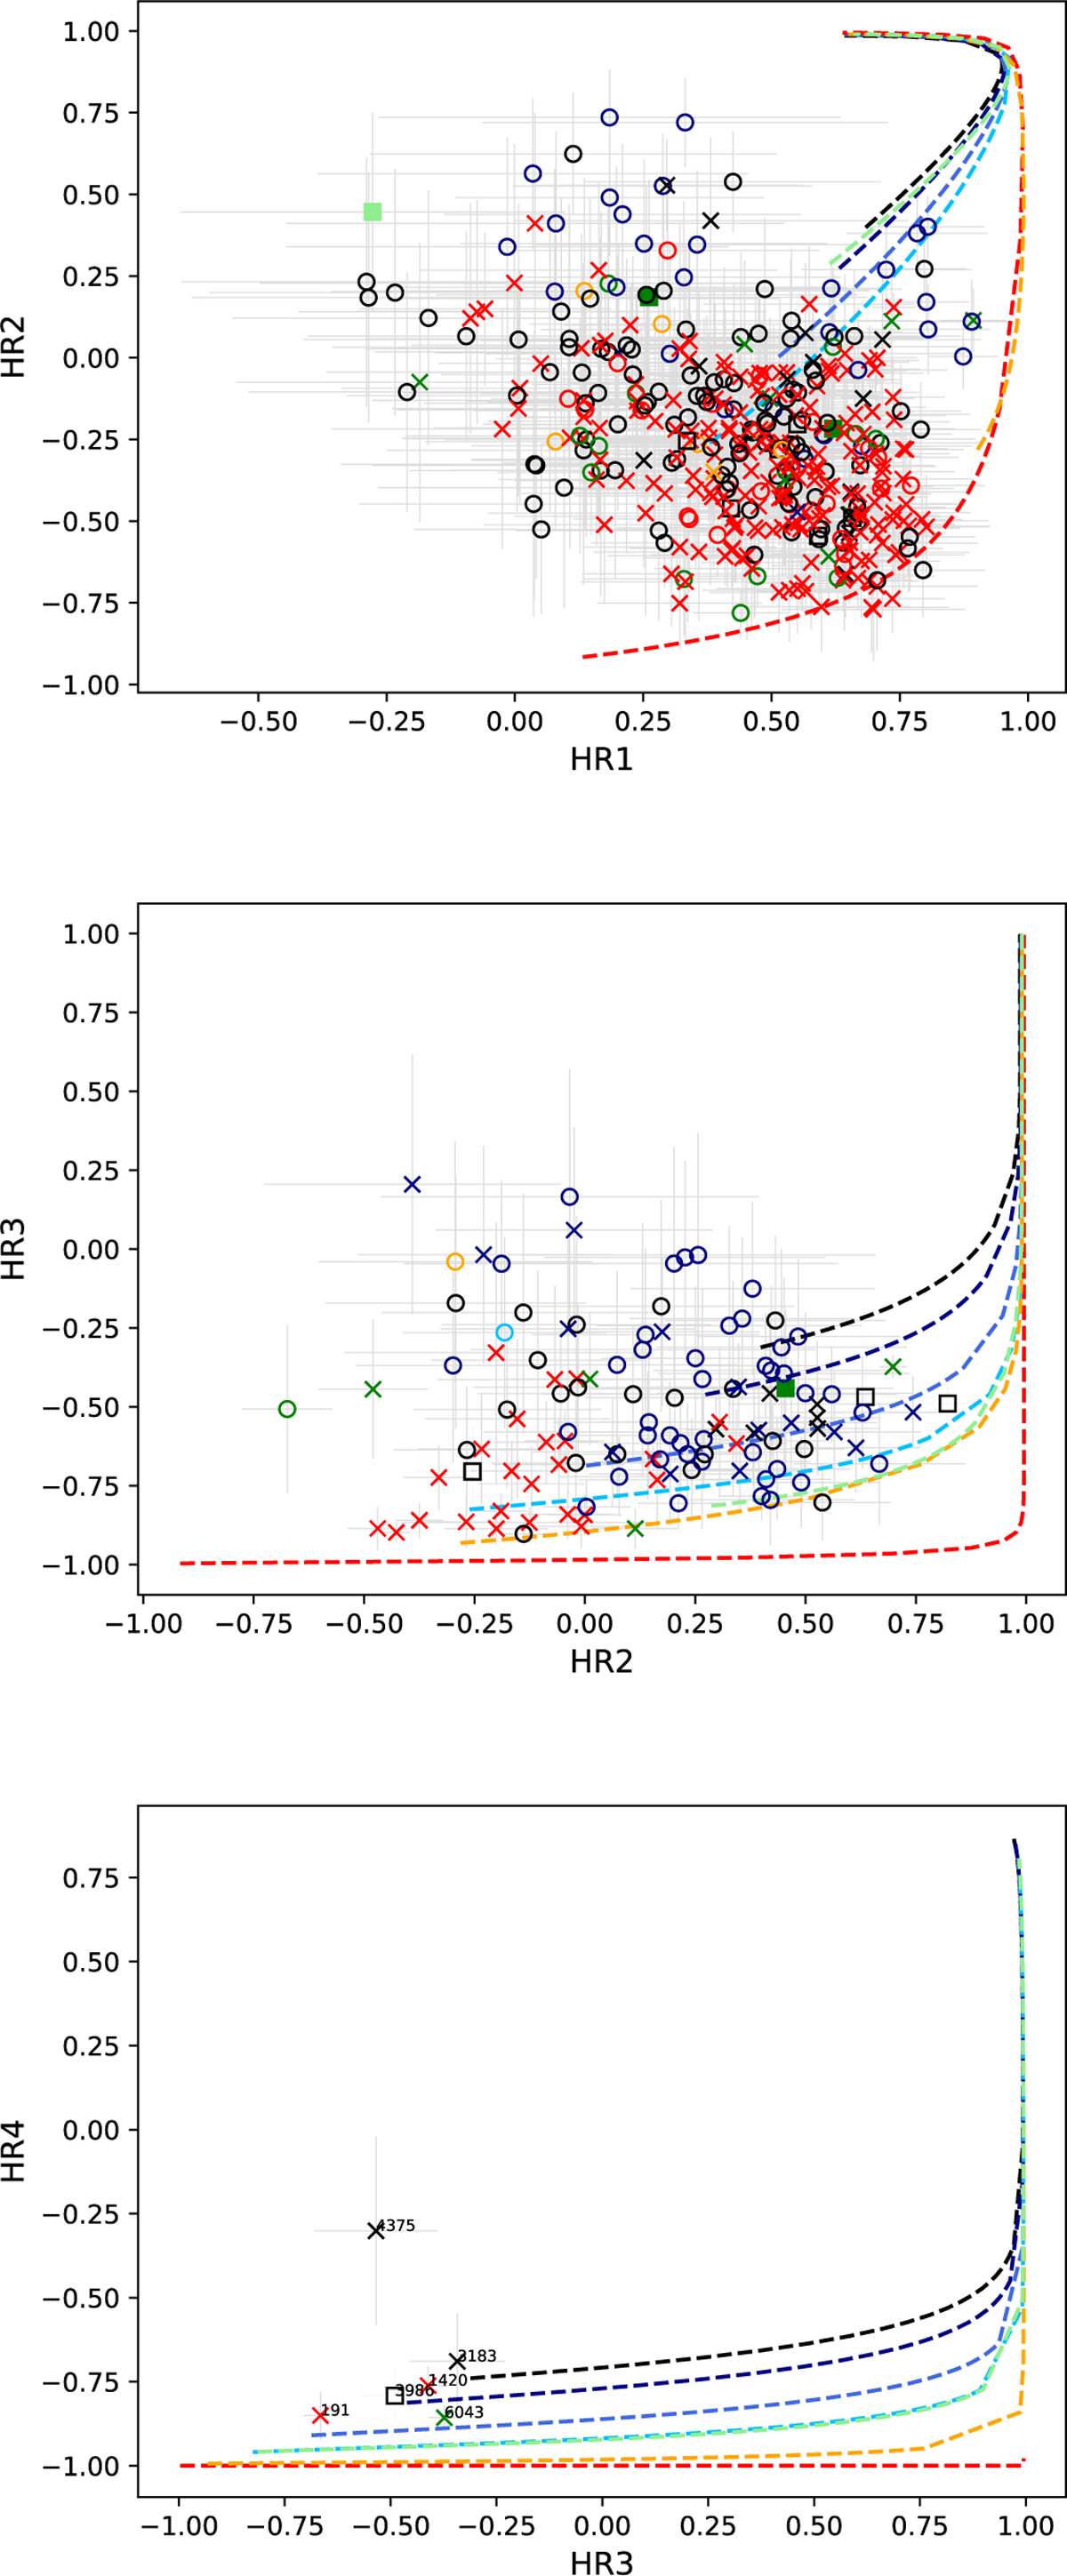
HR diagrams. The lines display the hardness ratios calculated for different spectral models. Black, navy, and blue lines show a power-law model with a photon index of Γ =1, 2, and 3, respectively. Red, yellow, and green lines show the apec model (Smith et al. 2001) for a thermal plasma with a temperature of kT = 0.2, 1.0, and 2.0 keV, respectively. The upper plot shows sources in the foreground, which therefore have very low absorbing foreground column density NH ; they appear to be softer than the others. The symbols and colours are the same as in Fig. 5. Additionally, those sources, which have no counterpart are shown with black squares.
Current usage metrics show cumulative count of Article Views (full-text article views including HTML views, PDF and ePub downloads, according to the available data) and Abstracts Views on Vision4Press platform.
Data correspond to usage on the plateform after 2015. The current usage metrics is available 48-96 hours after online publication and is updated daily on week days.
Initial download of the metrics may take a while.