Fig. 3
Download original image
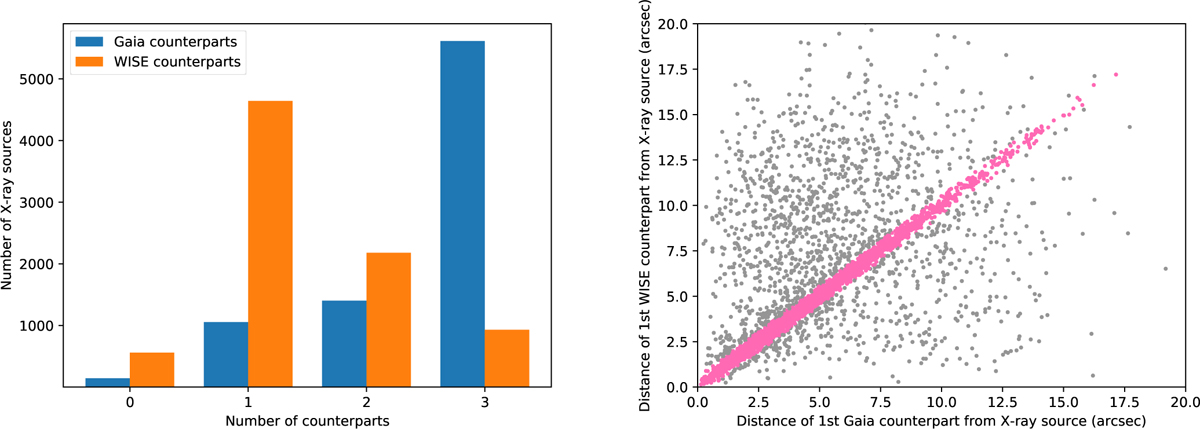
Number of X-ray sources in the field of CMa OD over the number of their counterparts (left). The plot shows the number of optical Gaia counterparts (in blue) and IR WISE counterparts (in orange) within the 3σ positional error of the X-ray sources. The plot on the right shows the distance of the first Gaia and WISE counterparts from the X-ray source in the field of CMa OD. Pink sources have first Gaia counterpart within the positional uncertainty of the first WISE counterparts, which can thus be considered to be the same source.
Current usage metrics show cumulative count of Article Views (full-text article views including HTML views, PDF and ePub downloads, according to the available data) and Abstracts Views on Vision4Press platform.
Data correspond to usage on the plateform after 2015. The current usage metrics is available 48-96 hours after online publication and is updated daily on week days.
Initial download of the metrics may take a while.