Fig. 2
Download original image
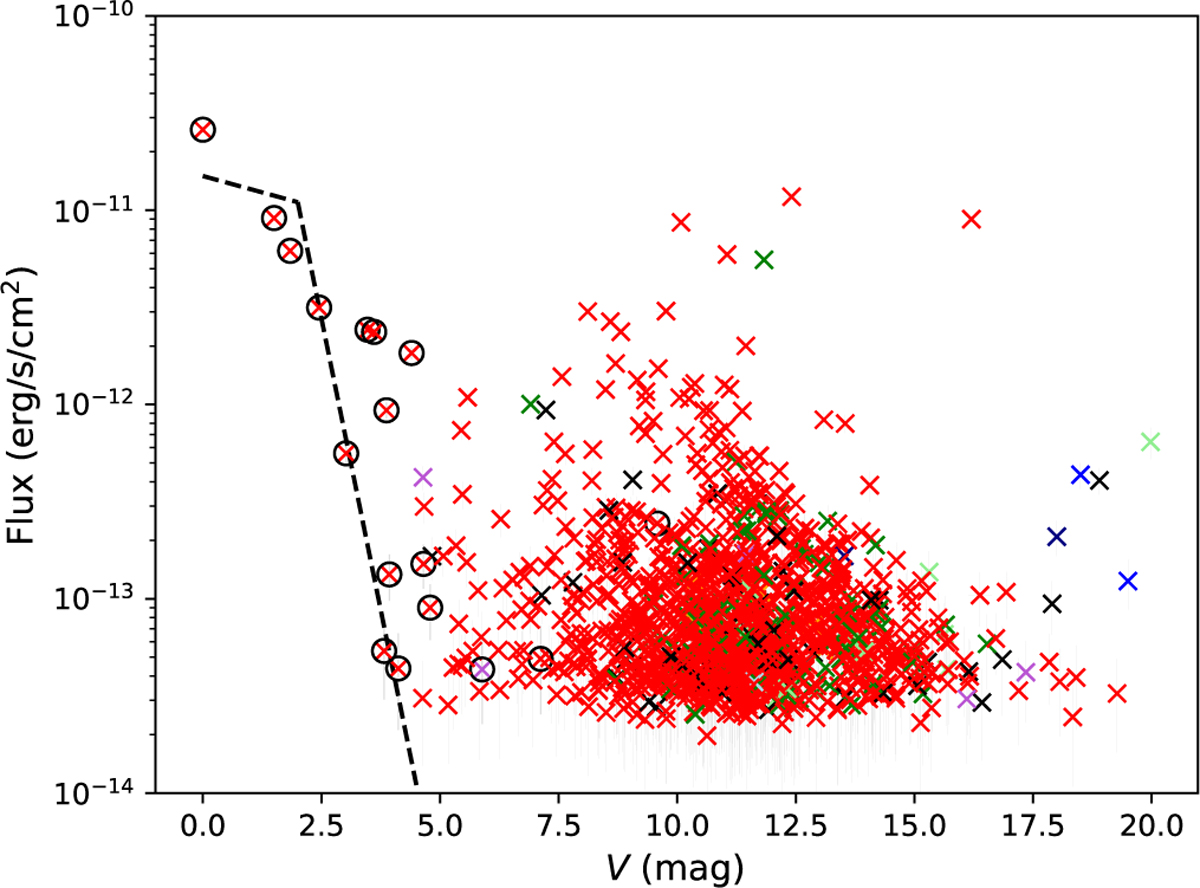
Flux (0.2–2.3 keV) of the X-ray sources versus the optical magnitude (V) of their counterparts from the SIMBAD data base. Galactic sources are labeled with a red cross. The AGNs and quasars are shown with blue crosses. Stellar objects for which the distances are not precisely estimated are shown with green crosses. The dashed line presents the X-ray flux threshold, which is caused by optical loading (Merloni et al. 2024). The sources with the optical loading problem are labelled with an extra black ring and their list is presented in Table 1.
Current usage metrics show cumulative count of Article Views (full-text article views including HTML views, PDF and ePub downloads, according to the available data) and Abstracts Views on Vision4Press platform.
Data correspond to usage on the plateform after 2015. The current usage metrics is available 48-96 hours after online publication and is updated daily on week days.
Initial download of the metrics may take a while.