Fig. 11
Download original image
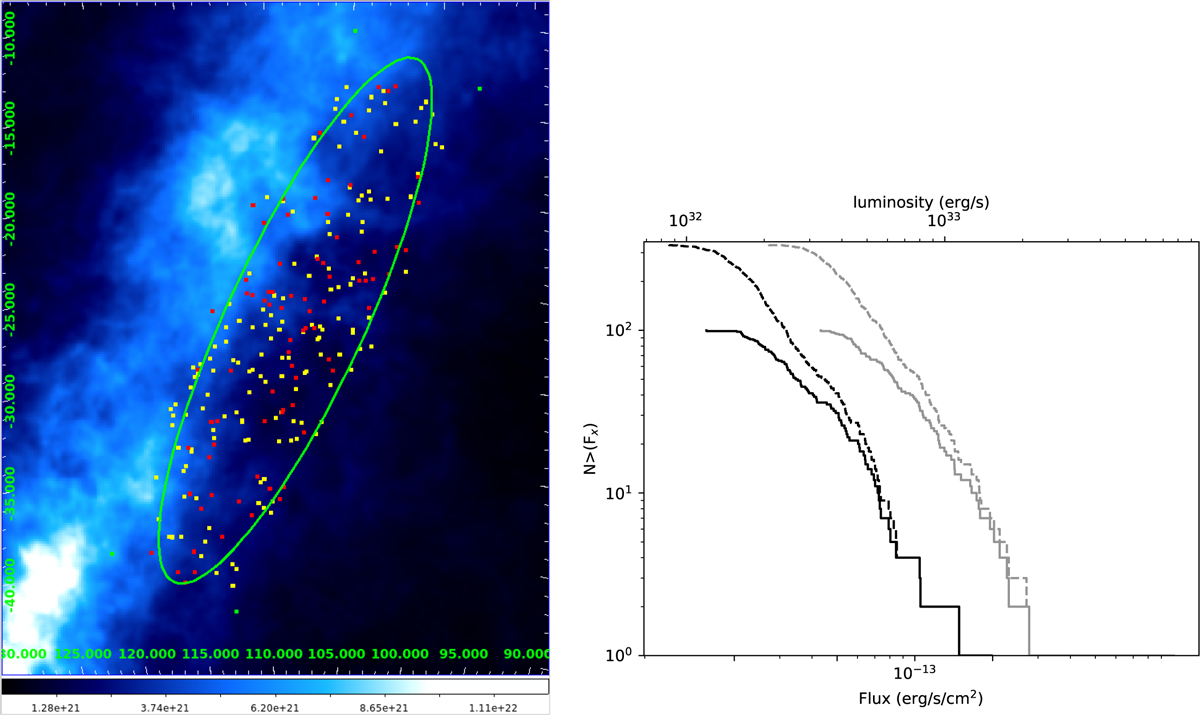
HI column density (NH) map in the CMa OD field from the HI4PI survey (left). The red dots show the position of X-ray sources classified as CMa OD members and the yellow dots are the CMa OD member candidates. The XLF of sources, which are classified as CMa OD members or candidates, are shown on the right. All sources (members and candidate members of CMa OD) are plotted by dashed lines and only the members by solid lines. The black and gray lines show the absorbed and unabsorbed fluxes, respectively.
Current usage metrics show cumulative count of Article Views (full-text article views including HTML views, PDF and ePub downloads, according to the available data) and Abstracts Views on Vision4Press platform.
Data correspond to usage on the plateform after 2015. The current usage metrics is available 48-96 hours after online publication and is updated daily on week days.
Initial download of the metrics may take a while.