Fig. 6.
Download original image
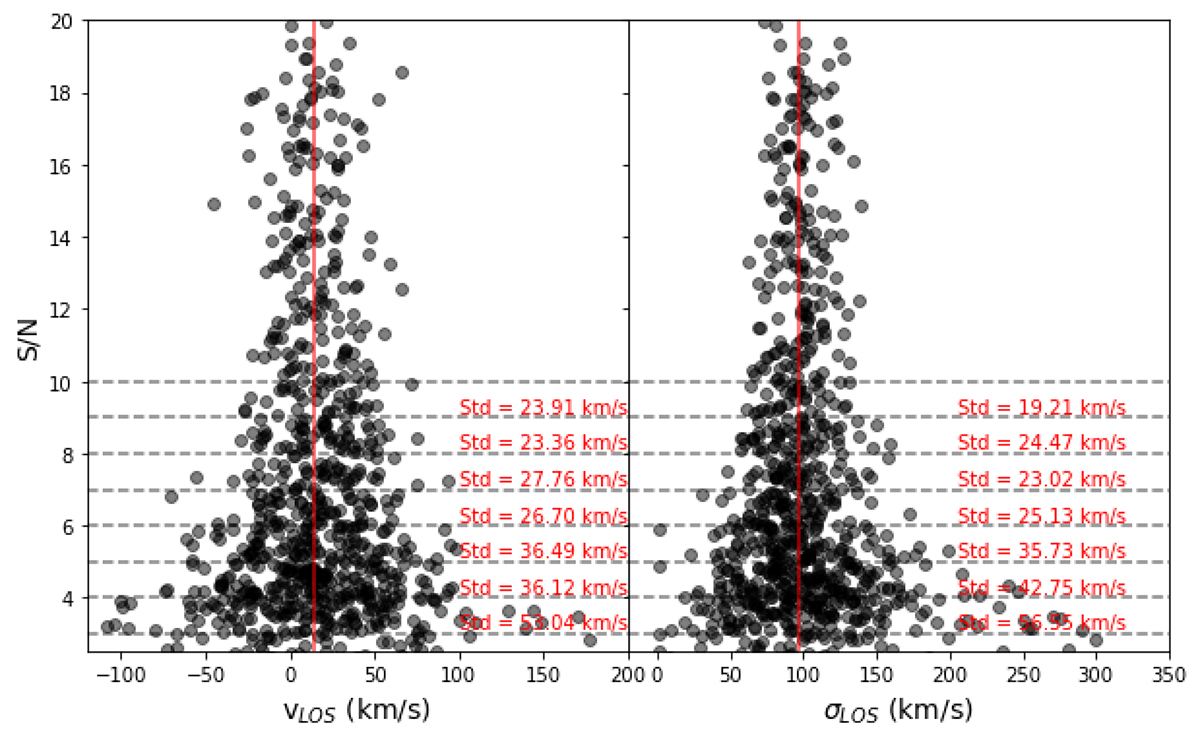
Scatter in the measurements of the velocity and velocity dispersion for stack spectra, resembling spectra of stacked RGB stars, as a function of the S/N. The red vertical lines indicate the median values of velocity and velocity dispersion, 14 and 96 km s−1 respectively. We also report the standard deviation at various levels of S/N, which decreases as the S/N increases.
Current usage metrics show cumulative count of Article Views (full-text article views including HTML views, PDF and ePub downloads, according to the available data) and Abstracts Views on Vision4Press platform.
Data correspond to usage on the plateform after 2015. The current usage metrics is available 48-96 hours after online publication and is updated daily on week days.
Initial download of the metrics may take a while.