Open Access
Fig. 4.
Download original image
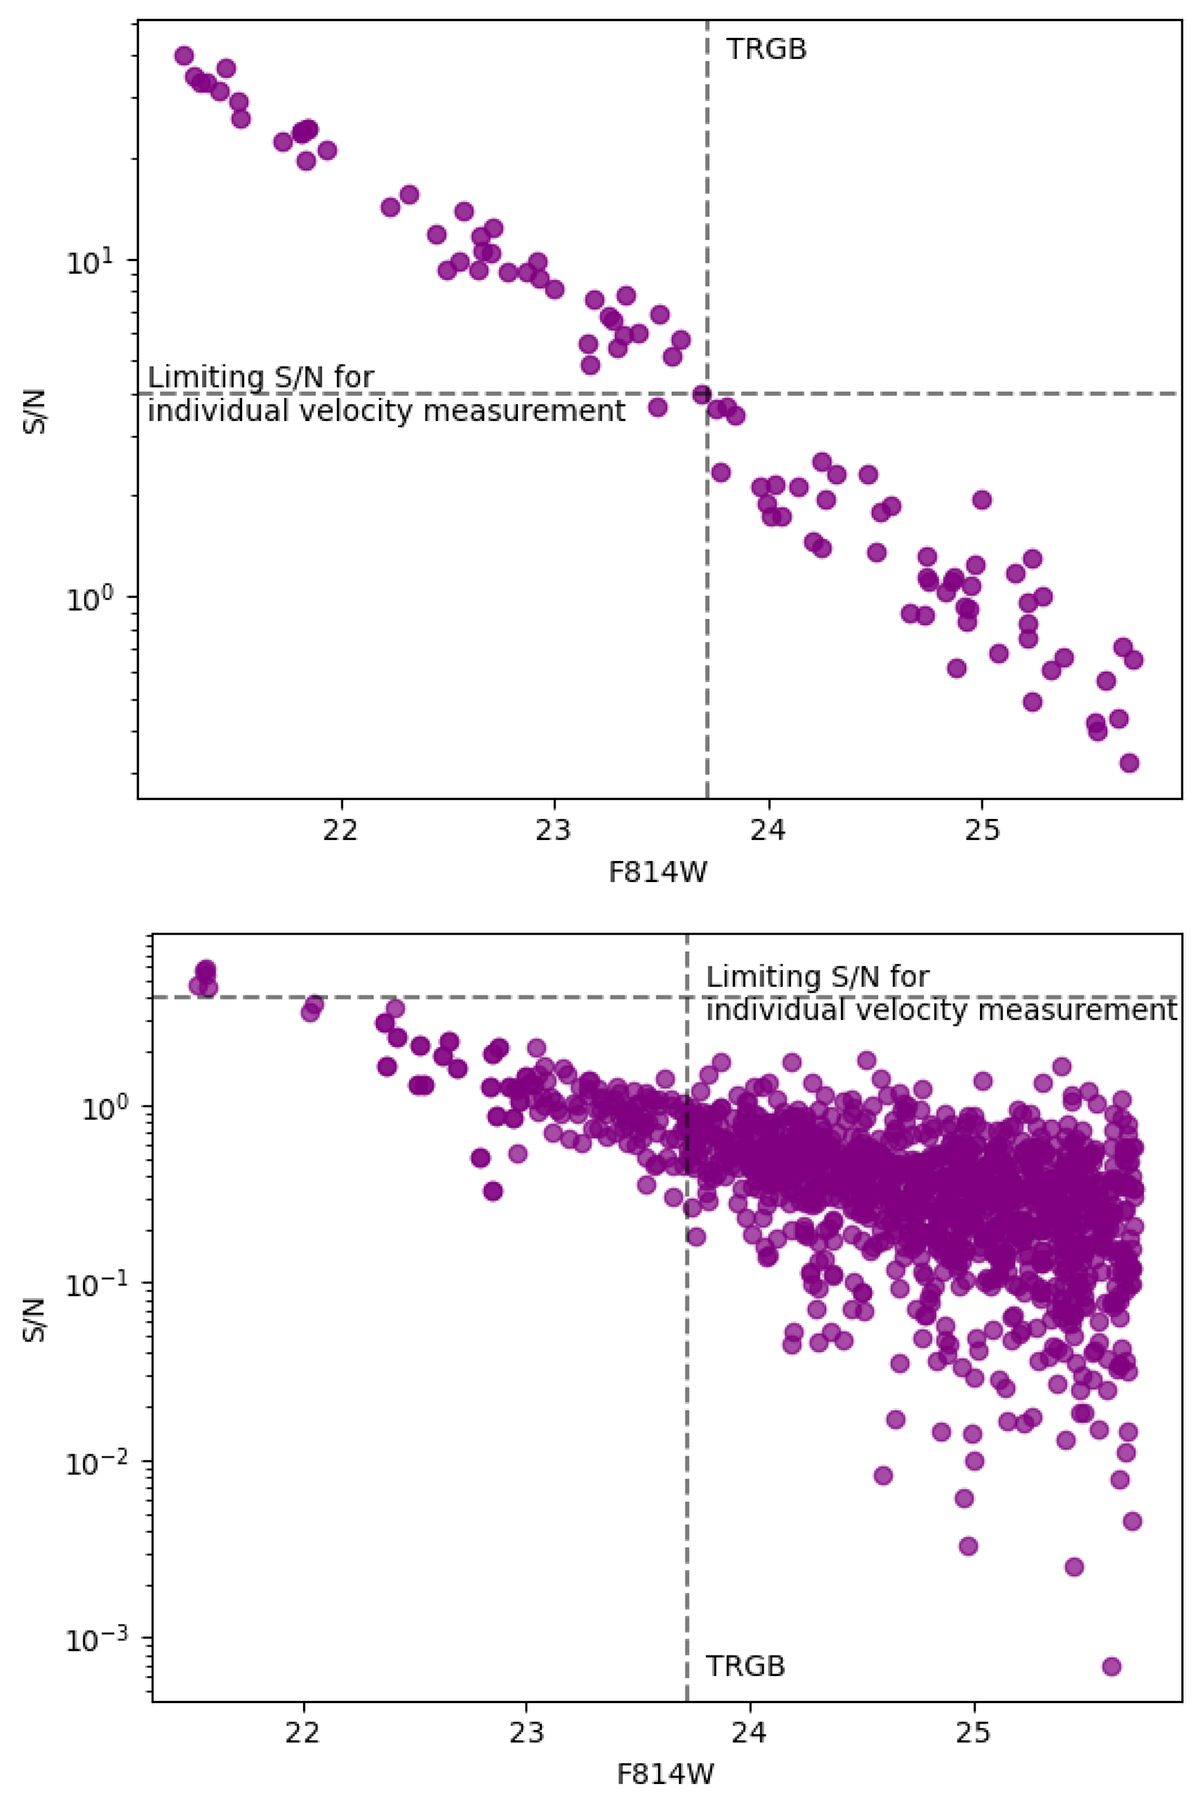
S/N per resolution element for each extracted spectra in the halo (top) and outer disk (bottom) fields measured in the CaT region 8400–8800 Å. The vertical line in the upper plot indicate the magnitude of the TRGB defined as the limit magnitude to measure individual velocities.
Current usage metrics show cumulative count of Article Views (full-text article views including HTML views, PDF and ePub downloads, according to the available data) and Abstracts Views on Vision4Press platform.
Data correspond to usage on the plateform after 2015. The current usage metrics is available 48-96 hours after online publication and is updated daily on week days.
Initial download of the metrics may take a while.