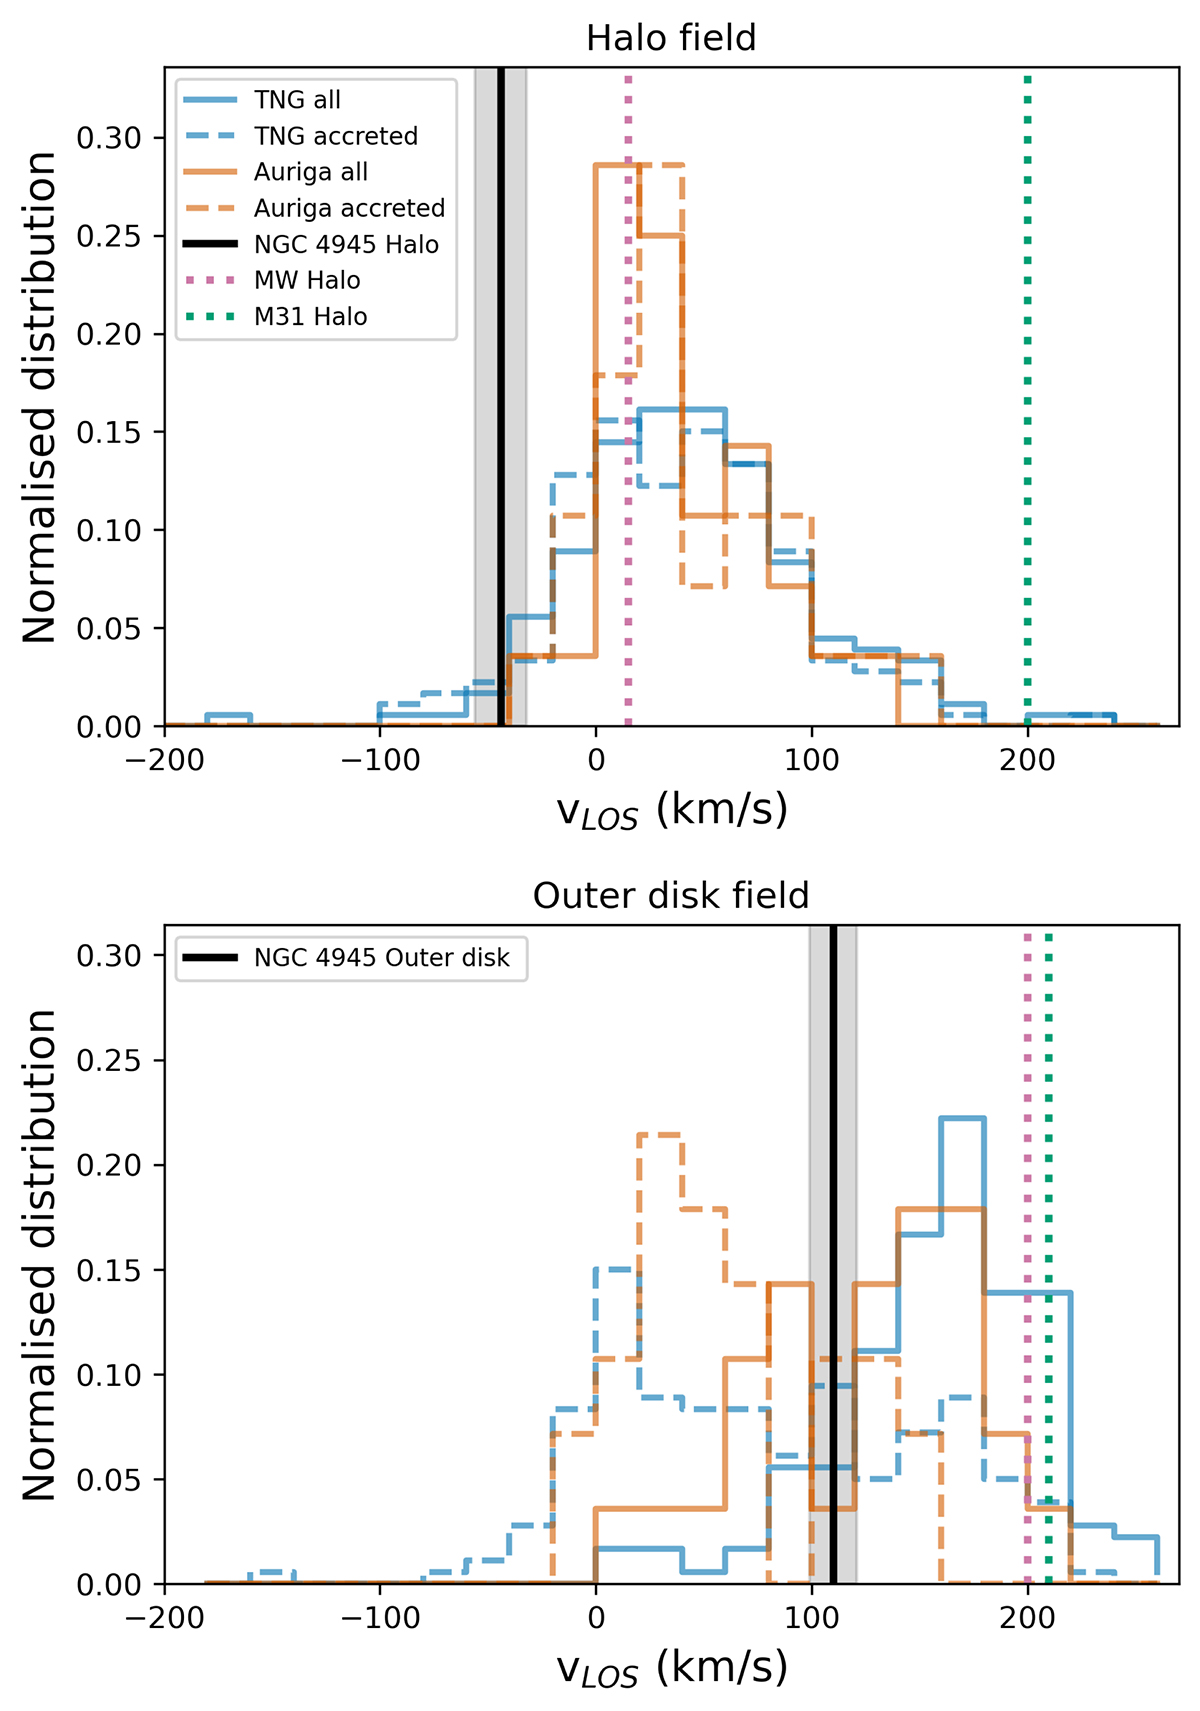
Fig. 11.
Download original image
Median LOS velocity distribution at galactocentric distances of 1.02Ropt (top) and 2.9Ropt (bottom) kpc along the major axis for MW/M31 like galaxies in an edge-on configuration, in the TNG50 (blue) and Auriga (orange) simulations. Black vertical lines are our velocity measurements for NGC 4945 at those distances, corrected for its systemic velocity. Green and pink dotted vertical lines show the halo rotational velocity of the MW (halo and outer disk, Deason et al. 2017; Bland-Hawthorn & Gerhard 2016, respectively) and M31 (halo and outer disk, Ibata et al. 2005; Zhang et al. 2024, respectively).
Current usage metrics show cumulative count of Article Views (full-text article views including HTML views, PDF and ePub downloads, according to the available data) and Abstracts Views on Vision4Press platform.
Data correspond to usage on the plateform after 2015. The current usage metrics is available 48-96 hours after online publication and is updated daily on week days.
Initial download of the metrics may take a while.