Fig. 10.
Download original image
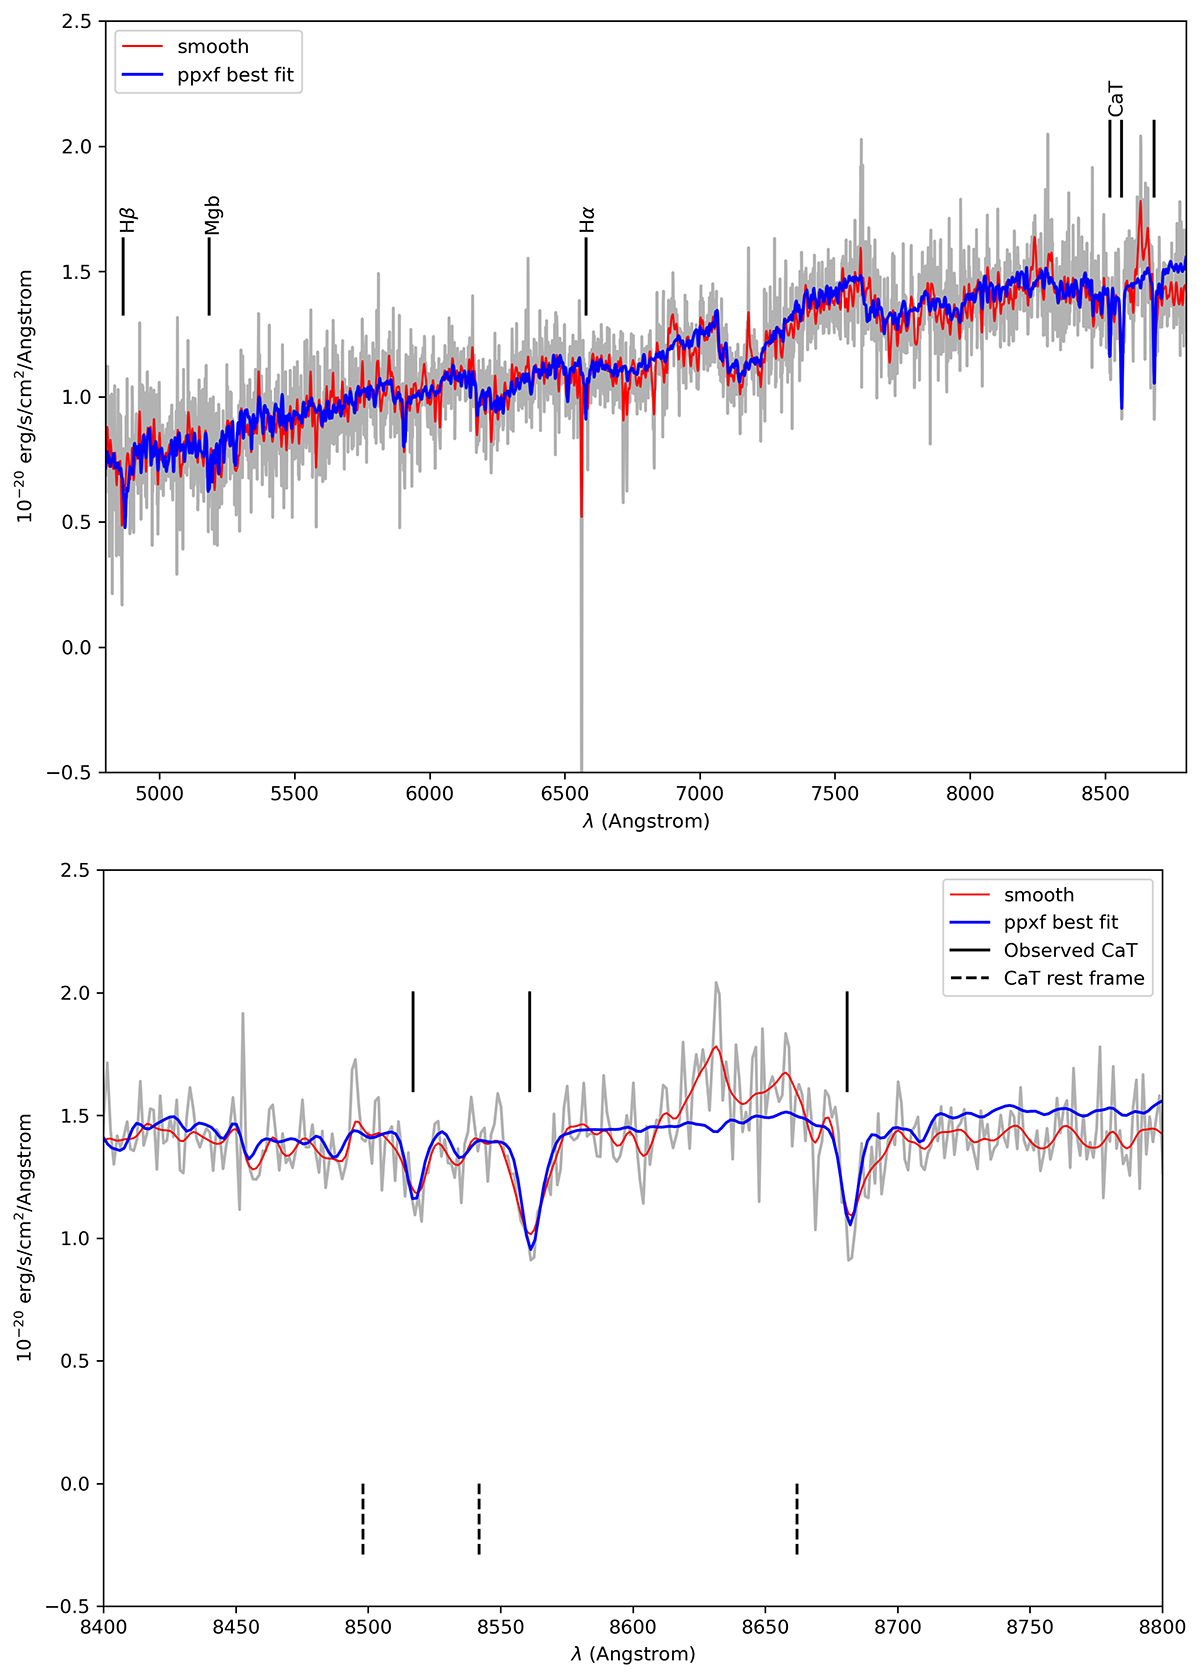
Stacked outer disk spectrum: Grey represents the mean co-added spectrum of AGB plus RGB stars with F814W magnitude brighter than 25.72. Red: Co-added spectrum smoothed by a Gaussian kernel of 2 pixels weighted by the inverse variance of the sky spectrum. Blue: Best fit from pPXF. Upper panel: Full spectrum wavelength, 4800–8800 Å, used to measure velocity with pPXF. Bottom panel: Zoom on the CaT region and marked with a black dashed lines the position of these lines: 8498, 8542 and 8662 Å in the restframe. Black solid lines mark the position of the observed CaT lines.
Current usage metrics show cumulative count of Article Views (full-text article views including HTML views, PDF and ePub downloads, according to the available data) and Abstracts Views on Vision4Press platform.
Data correspond to usage on the plateform after 2015. The current usage metrics is available 48-96 hours after online publication and is updated daily on week days.
Initial download of the metrics may take a while.