Fig. 6
Download original image
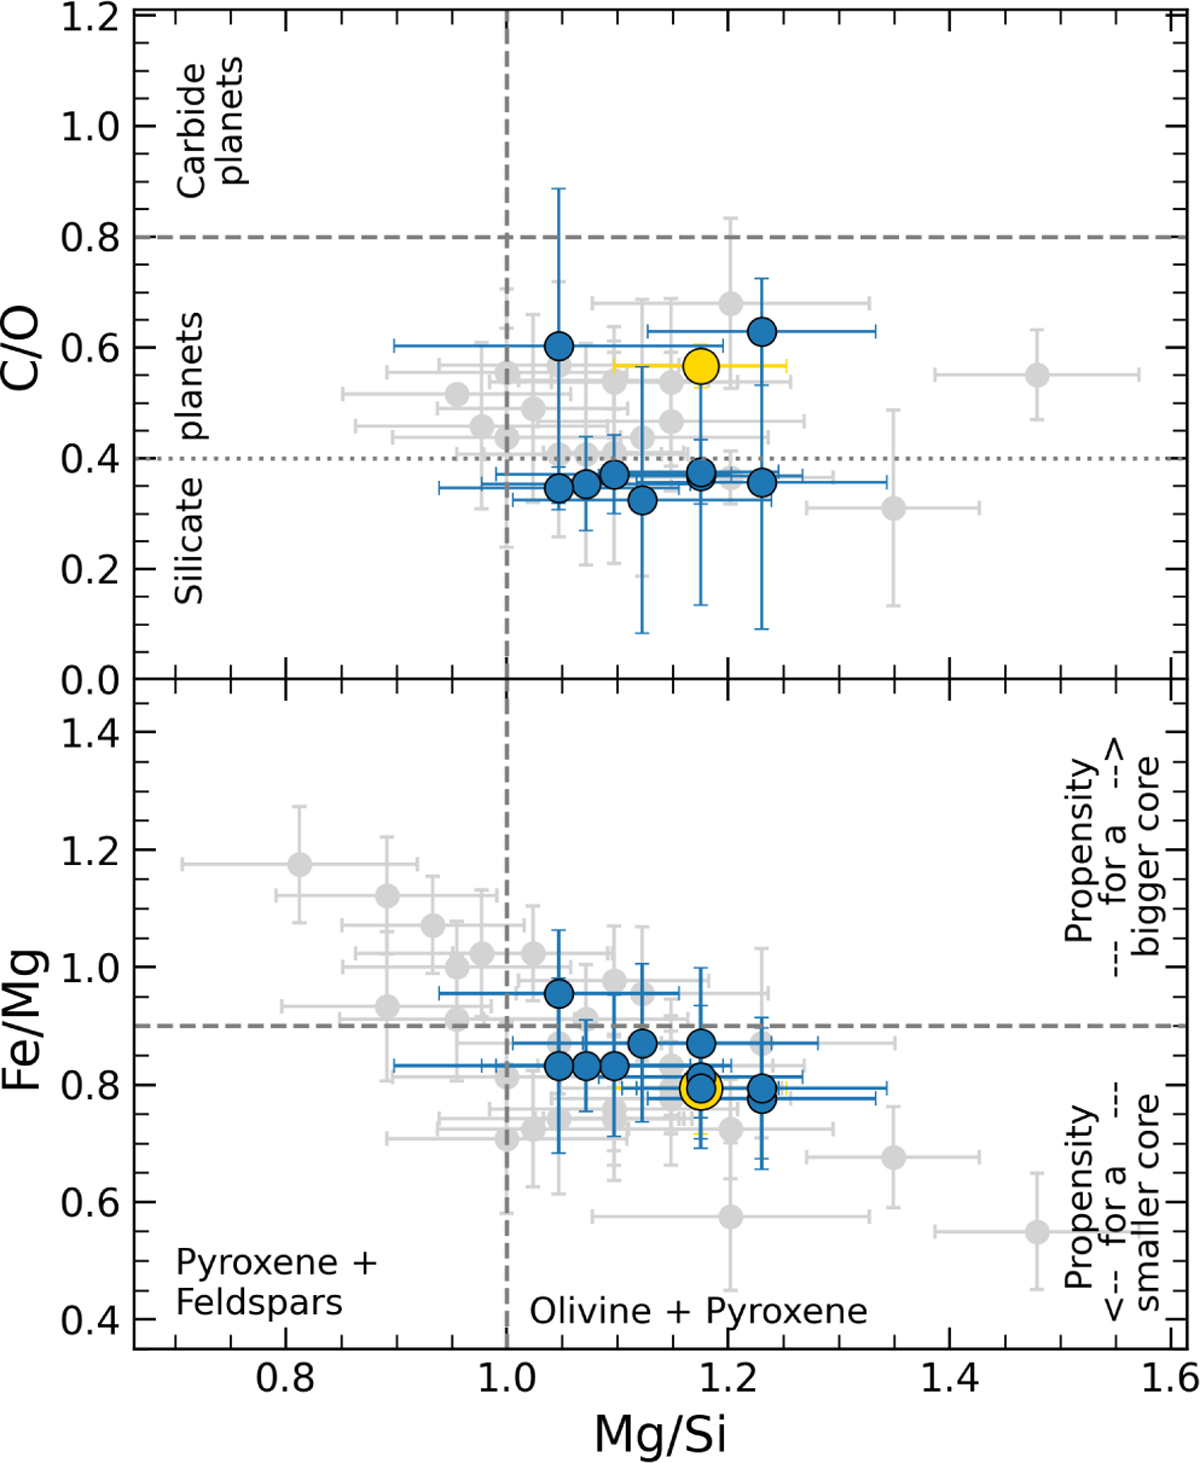
C/O (upper panel) and Fe/Mg (lower panel) ratios versus Mg/Si. In grey, the results by Biazzo et al. (2022) are shown, while the yellow big dot in both panels represents the position of the Sun as derived by the same authors (see also Biazzo & GAPS Team 2023). Vertical lines represent Mg/Si=1.0 (Thiabaud et al. 2015), while horizontal lines are plotted for C/O=0.4, 0.8 (Suárez-Andrés et al. 2018), and for Fe/Mg=0.9 (Wang et al. 2022).
Current usage metrics show cumulative count of Article Views (full-text article views including HTML views, PDF and ePub downloads, according to the available data) and Abstracts Views on Vision4Press platform.
Data correspond to usage on the plateform after 2015. The current usage metrics is available 48-96 hours after online publication and is updated daily on week days.
Initial download of the metrics may take a while.