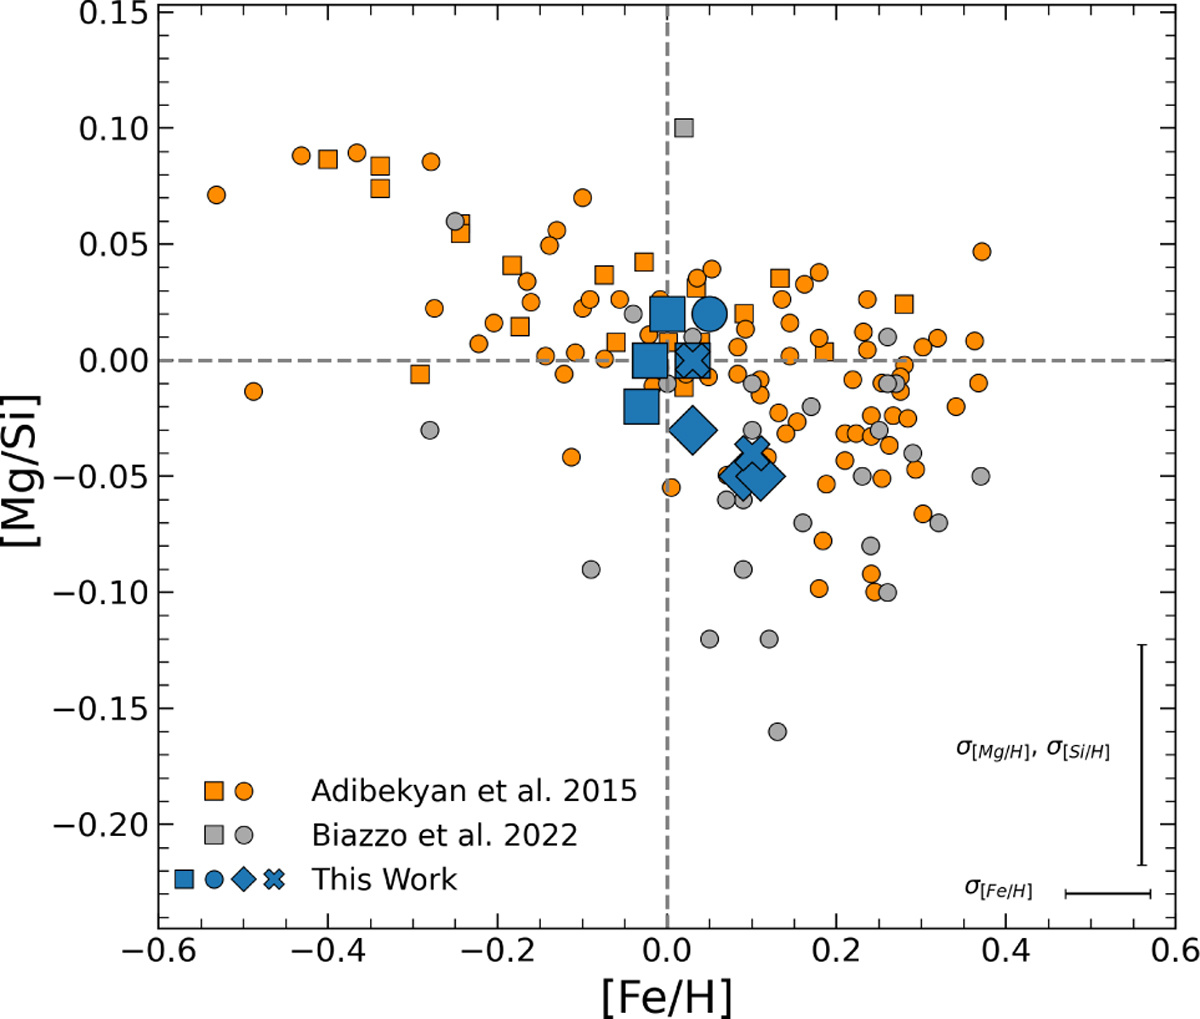
Fig. 5
Download original image
[Mg/Si] versus [Fe/H] for our sample (blue points), where mean errors on [Mg/H], [Si/H], and [Fe/H] are similar to each other (~0.09–0.10 dex; as a reference, typical errors in Mg, Si, and Fe abundances are represented in the bottom right corner of the plot). Overplotted in grey and orange are the results by Biazzo et al. (2022) and Adibekyan et al. (2015), respectively. As in Adibekyan et al. (2015), squares and circles represent targets hosting only planets with Mp < 30 ME (low-mass planets) and Mp > 30 ME (high-mass planets), respectively. Within our sample, we mark with diamonds those targets hosting both high- and low-mass planets and with crosses targets whose planets have not a mass estimate yet. Dashed lines represent the solar abundances.
Current usage metrics show cumulative count of Article Views (full-text article views including HTML views, PDF and ePub downloads, according to the available data) and Abstracts Views on Vision4Press platform.
Data correspond to usage on the plateform after 2015. The current usage metrics is available 48-96 hours after online publication and is updated daily on week days.
Initial download of the metrics may take a while.