Fig. 4
Download original image
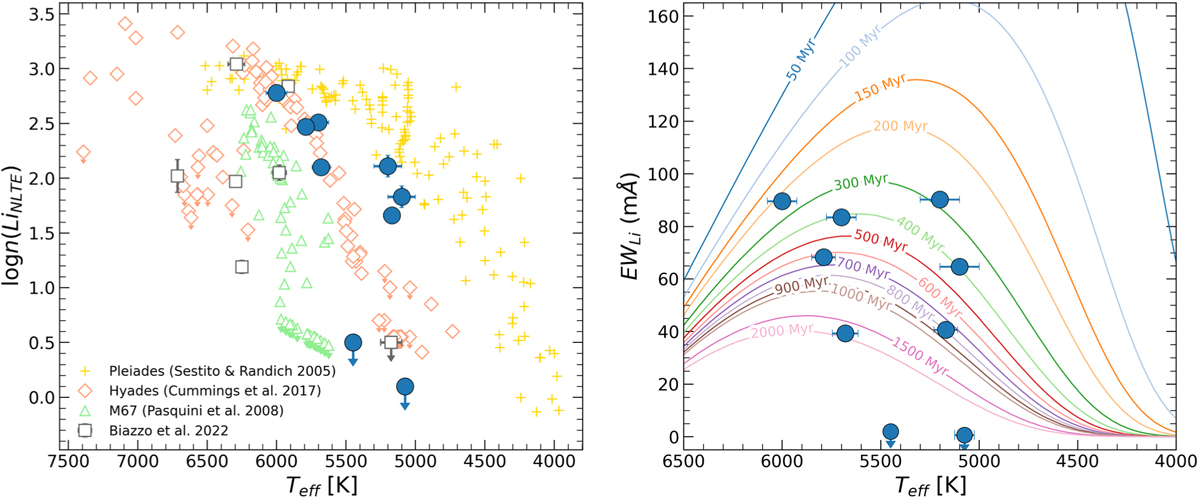
Lithium abundance and equivalent width vs. Teff plots. Left: non-LTE Li abundance, log ϵ(Li), versus effective temperature, Teff. The targets of this work (blue filled dots) are plotted together with the targets from Biazzo et al. (2022) in grey open squares and the members of the Pleiades (~100 Myr; Sestito & Randich 2005), Hyades (~600 Myr; Cummings et al. 2017), and M67 (~4.5 Gyr; Pasquini et al. 2008) clusters (in yellow crosses, red diamonds, and green triangles, respectively). Right: lithium equivalent width (EWLi) versus effective temperature. Here, the empirical model isochrones by Jeffries et al. (2023) at 50, 100, 150, 200, 300, 400, 500, 600, 700, 800, 900 Myr, 1, 1.5, and 2 Gyr are overplotted.
Current usage metrics show cumulative count of Article Views (full-text article views including HTML views, PDF and ePub downloads, according to the available data) and Abstracts Views on Vision4Press platform.
Data correspond to usage on the plateform after 2015. The current usage metrics is available 48-96 hours after online publication and is updated daily on week days.
Initial download of the metrics may take a while.