Fig. 1
Download original image
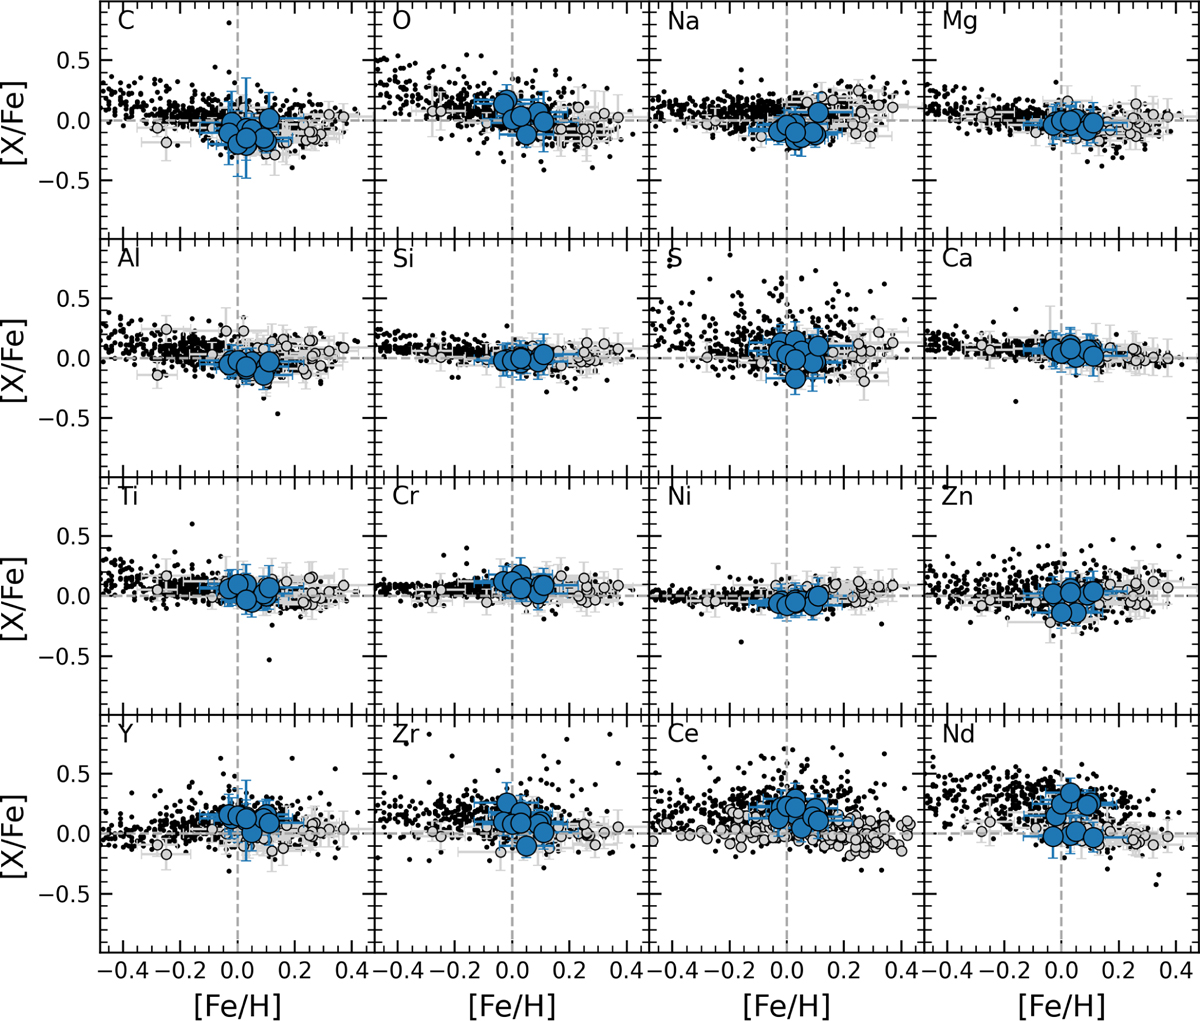
[X/Fe] versus [Fe/H] for our sample (filled blue dots). Horizontal and vertical dashed lines mark the solar abundances. Filled grey dots represent the [X/Fe] values of old transiting planet host stars analysed by Biazzo et al. (2022), except for Ce for which we plot the values by Delgado Mena et al. (2017). Small black dots in the background represent the [X/Fe] distribution of nearby field stars (distance ≤200 pc) in the Galactic thin disk with similar parameters as those of our sample (Hinkel et al. 2014).
Current usage metrics show cumulative count of Article Views (full-text article views including HTML views, PDF and ePub downloads, according to the available data) and Abstracts Views on Vision4Press platform.
Data correspond to usage on the plateform after 2015. The current usage metrics is available 48-96 hours after online publication and is updated daily on week days.
Initial download of the metrics may take a while.