Fig. 11.
Download original image
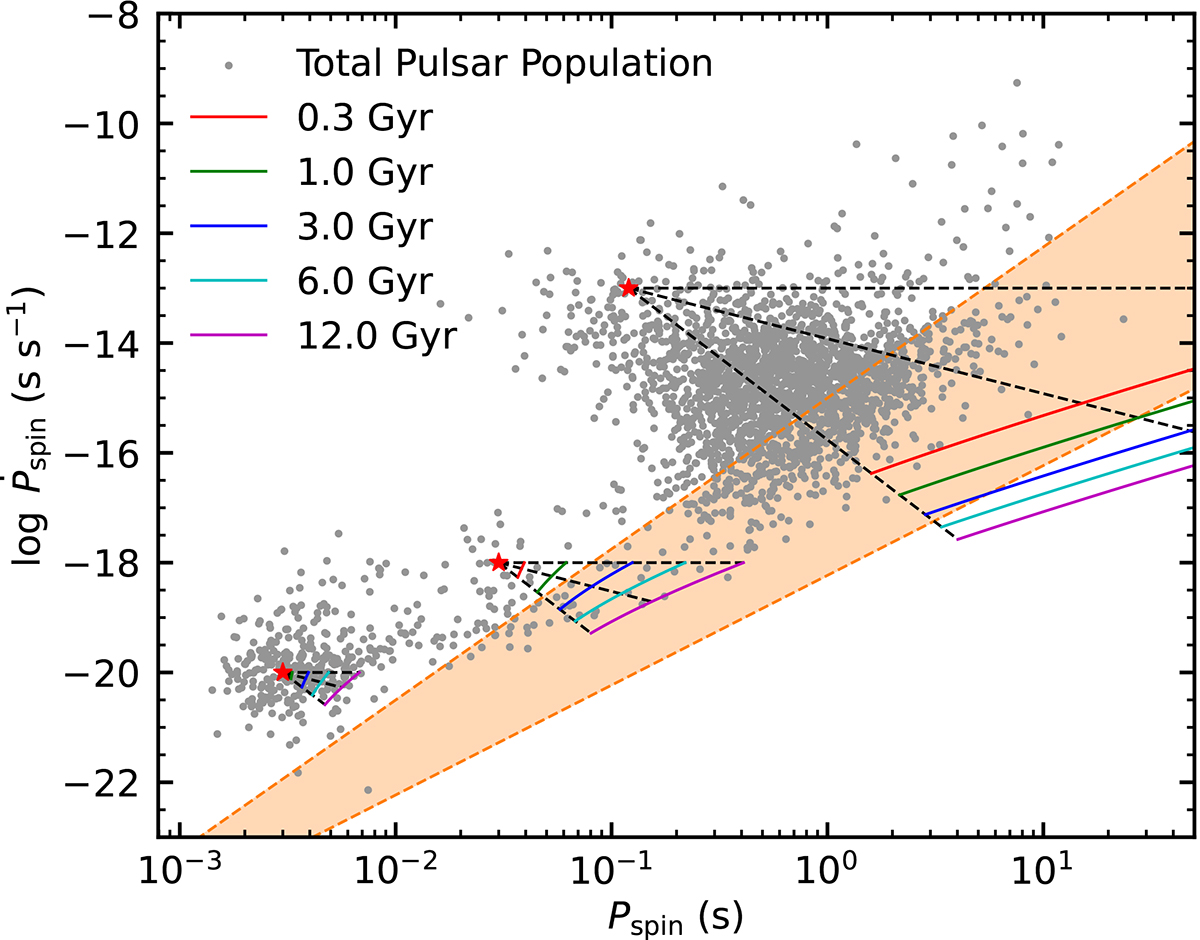
Isochrones of three hypothetical pulsars. The gray dots show the currently observed population of pulsars. The data are taken from the ANTF pulsar catalog (Manchester et al. 2005). The red stars indicate the birth positions of the hypothetical pulsars. The colored lines indicate isochrones and were calculated for different values of the braking index 2 ≤ n ≤ 5. The dashed black lines from top to bottom indicate the evolution of n = 2, 3, and 5. The shaded orange area indicates the so-called death valley (Rea et al. 2024).
Current usage metrics show cumulative count of Article Views (full-text article views including HTML views, PDF and ePub downloads, according to the available data) and Abstracts Views on Vision4Press platform.
Data correspond to usage on the plateform after 2015. The current usage metrics is available 48-96 hours after online publication and is updated daily on week days.
Initial download of the metrics may take a while.