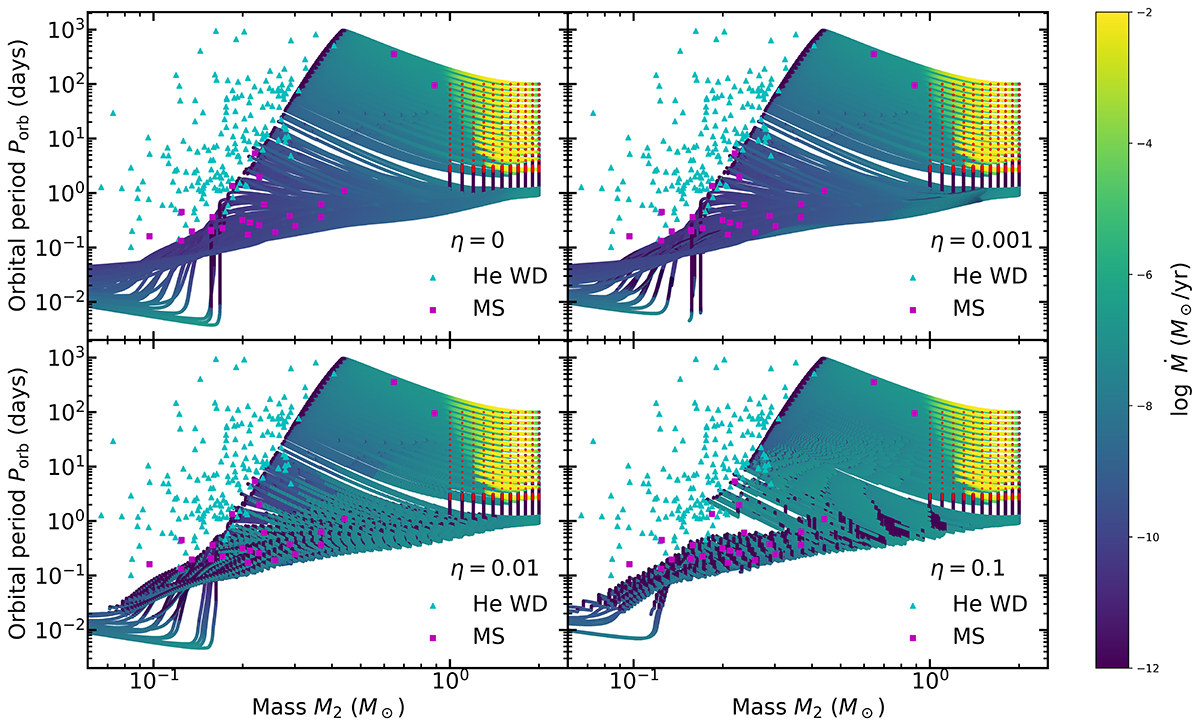
Fig. 1.
Download original image
Binary evolution results in a M2 − Porb diagram. The observed binary pulsars with He WDs and MSs are plotted as cyan upward-pointing triangles and magenta squares, and the masses are the lowest possible masses of the companions of observed binary pulsars. The red dots indicate the initial grid. The color bar indicates the mass-transfer rate. The different panels show different irradiation efficiencies.
Current usage metrics show cumulative count of Article Views (full-text article views including HTML views, PDF and ePub downloads, according to the available data) and Abstracts Views on Vision4Press platform.
Data correspond to usage on the plateform after 2015. The current usage metrics is available 48-96 hours after online publication and is updated daily on week days.
Initial download of the metrics may take a while.