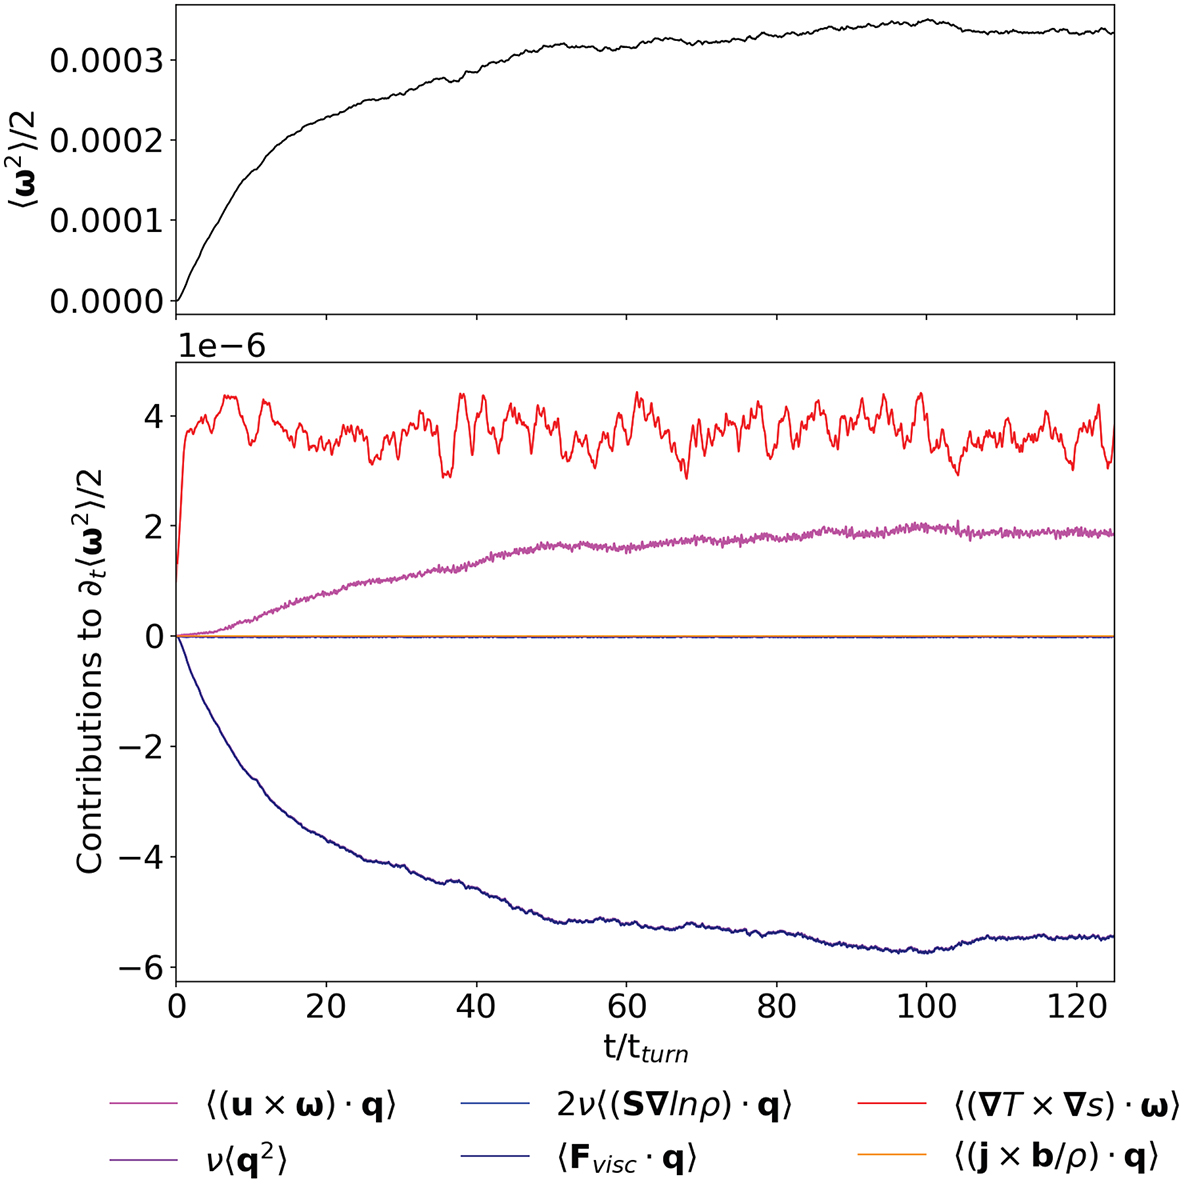
Fig. 7.
Download original image
Time evolution for ωrms2/2 (left axis and gray line) and vorticity growth terms (right axis and various colored lines for each term) for a non-isothermal run with R = 0.5 and forcing in acceleration form (and by construction its contribution to ⟨∂tω2/2⟩ is zero). This plot zooms in on the beginning of the temporal evolution of all the terms until t ≃ 130 tturn. However, the saturation regime does not present any relevant changes in time for more than 2000 tturn, and no instability is reached. Both the 2ν⟨S∇lnρ ⋅ q⟩ and ⟨(j × b/ρ)⋅q⟩ terms are negligible and very close to 0, so this makes the total contribution of viscous forces, i.e., ⟨Fvisc ⋅ q⟩, overlap with ν⟨q2⟩.
Current usage metrics show cumulative count of Article Views (full-text article views including HTML views, PDF and ePub downloads, according to the available data) and Abstracts Views on Vision4Press platform.
Data correspond to usage on the plateform after 2015. The current usage metrics is available 48-96 hours after online publication and is updated daily on week days.
Initial download of the metrics may take a while.