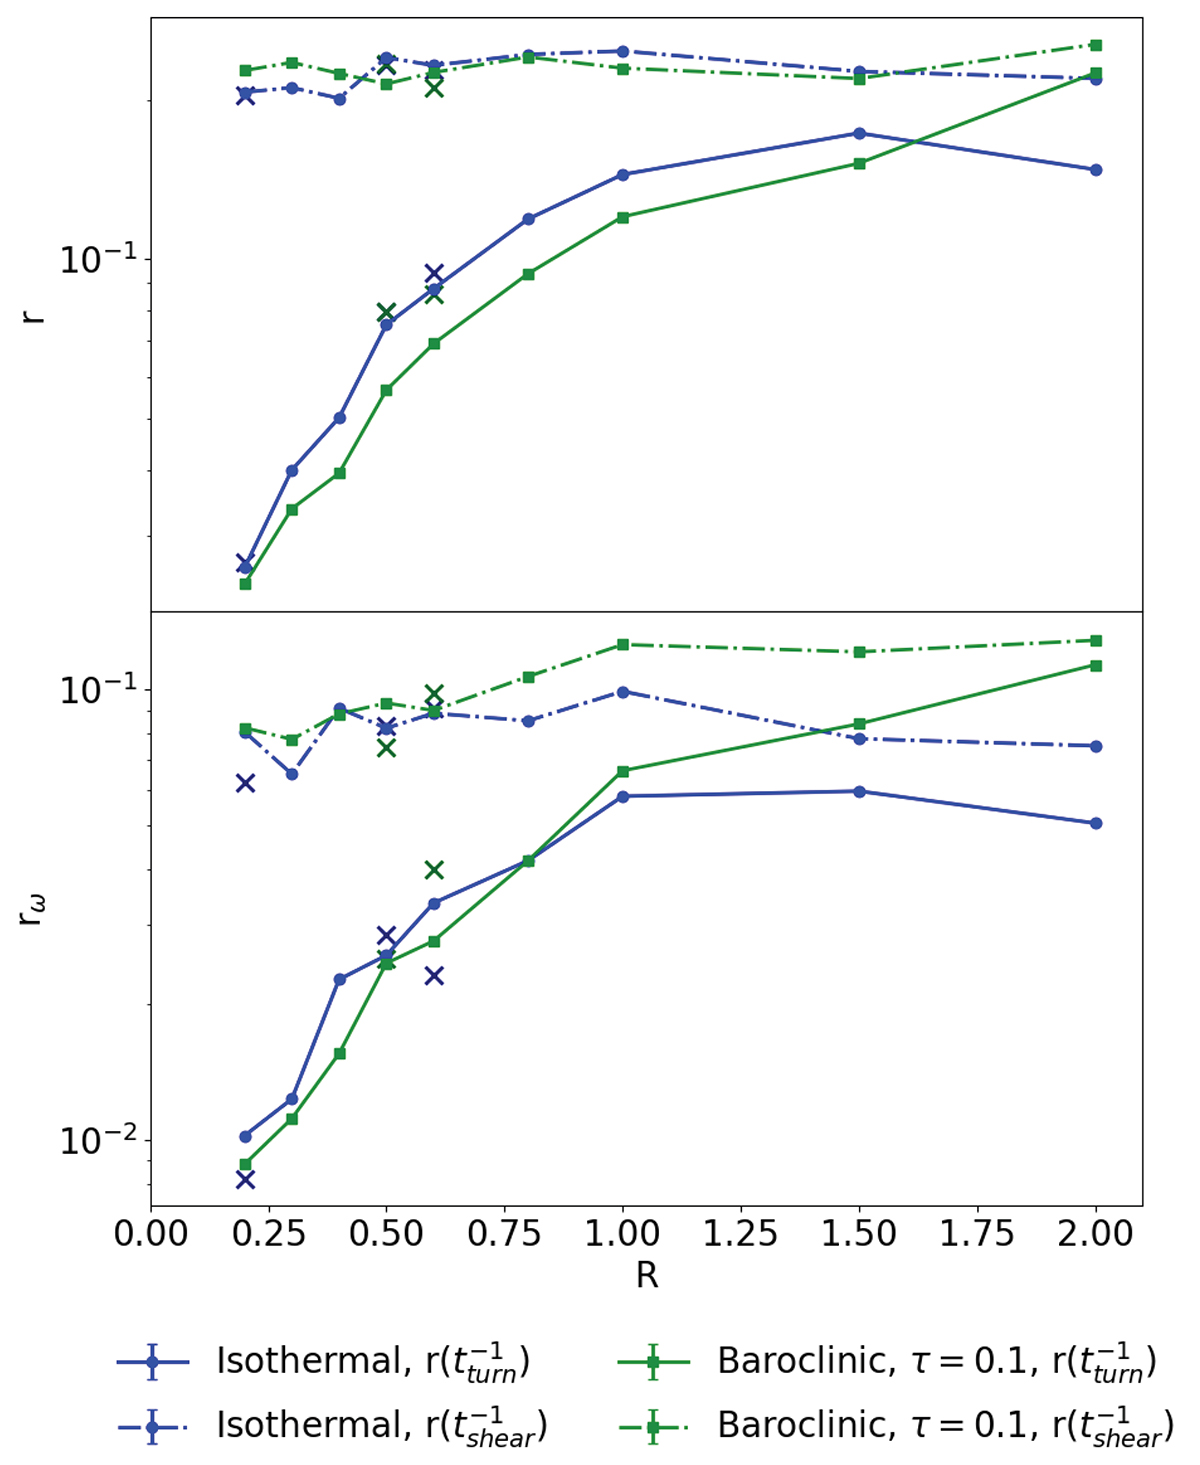
Fig. 5.
Download original image
Vorticity and magnetic energy growth rates as a function of explosion width, R. The blue lines represent the isothermal models and the green ones the baroclinic cases. The dash-dotted lines correspond to growth rates in time units of tshear and solid lines in forcing turnover times, tturn. Both time units are tabulated in Appendix A. The points marked with crosses are the corresponding dynamo runs with fmom.
Current usage metrics show cumulative count of Article Views (full-text article views including HTML views, PDF and ePub downloads, according to the available data) and Abstracts Views on Vision4Press platform.
Data correspond to usage on the plateform after 2015. The current usage metrics is available 48-96 hours after online publication and is updated daily on week days.
Initial download of the metrics may take a while.