Fig. 4.
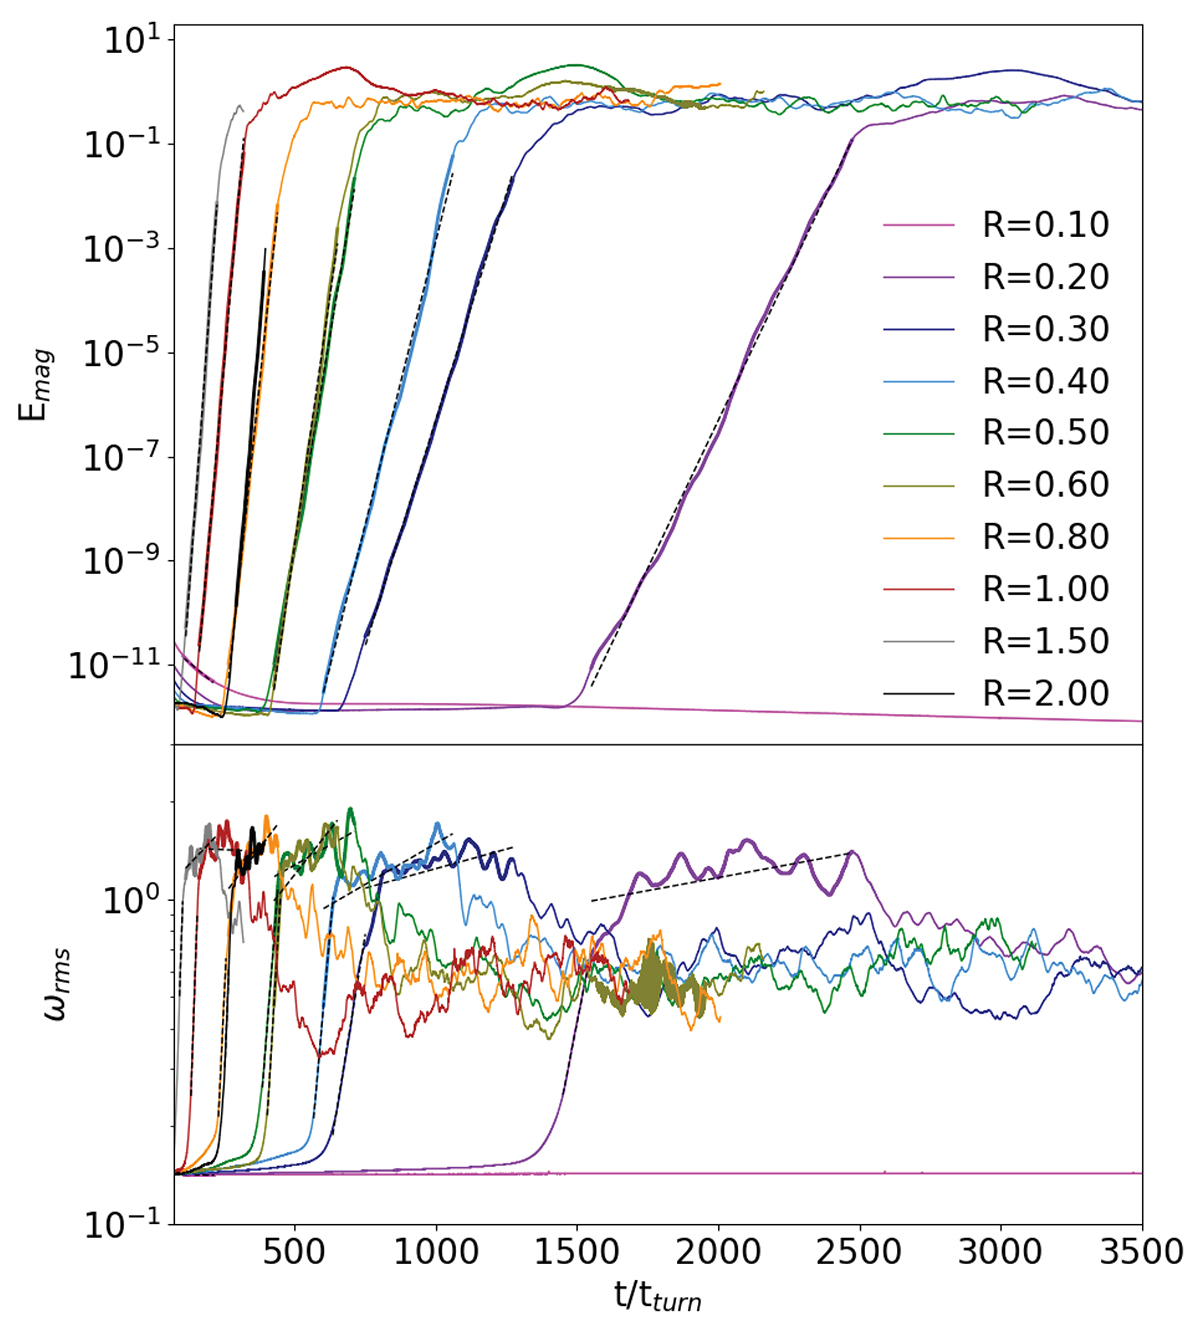
Download original image
Time evolution (in units of tturn) of vorticity and magnetic energy of runs with the shearing profile and different R (see Table A.3). If we use the shearing timescales, the magnetic instability is between 70 and 200 tshear with more similar growth rates (see Fig. 5). In both cases, R = 1.00 and R = 1.50 take the least amount of time to reach the instability. Dashed lines represent the exponential fits for Emag during dynamo growth (top panel), ωrms during vorticity growth, and ωrms during dynamo growth (bottom panel).
Current usage metrics show cumulative count of Article Views (full-text article views including HTML views, PDF and ePub downloads, according to the available data) and Abstracts Views on Vision4Press platform.
Data correspond to usage on the plateform after 2015. The current usage metrics is available 48-96 hours after online publication and is updated daily on week days.
Initial download of the metrics may take a while.