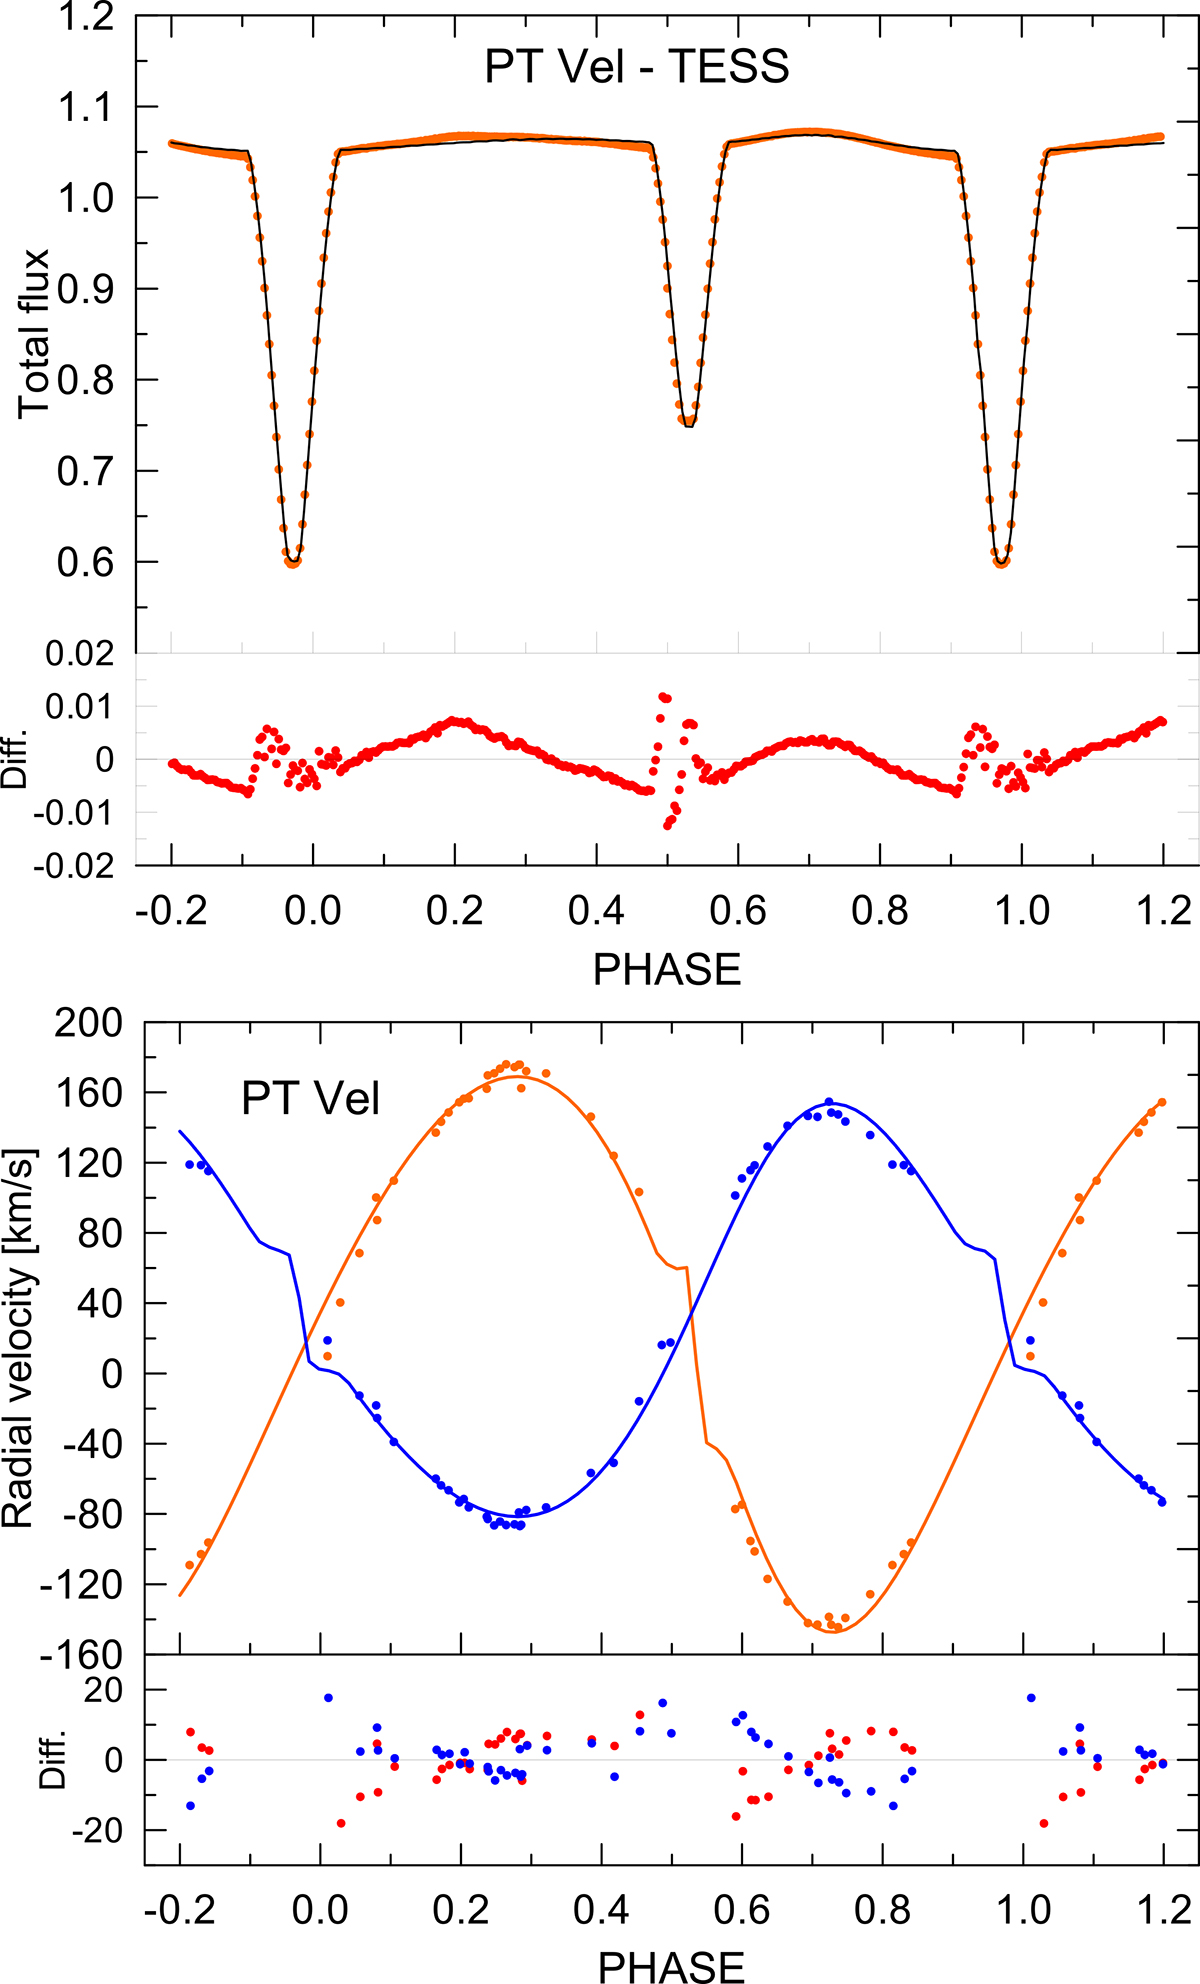
Fig. 8.
Download original image
Solution of light and radial velocity curves for PT Vel. Upper panel: TESS light curve (orange circles, binning 300) and its PHOEBE solution (black curve). Lower panel: Radial velocity curve of PT Vel obtained by Bakış et al. (2008) and new data, and its PHOEBE solution. Primary component in blue, secondary component in orange. The residuals of the solution are plotted in the bottom panels.
Current usage metrics show cumulative count of Article Views (full-text article views including HTML views, PDF and ePub downloads, according to the available data) and Abstracts Views on Vision4Press platform.
Data correspond to usage on the plateform after 2015. The current usage metrics is available 48-96 hours after online publication and is updated daily on week days.
Initial download of the metrics may take a while.