Fig. 8.
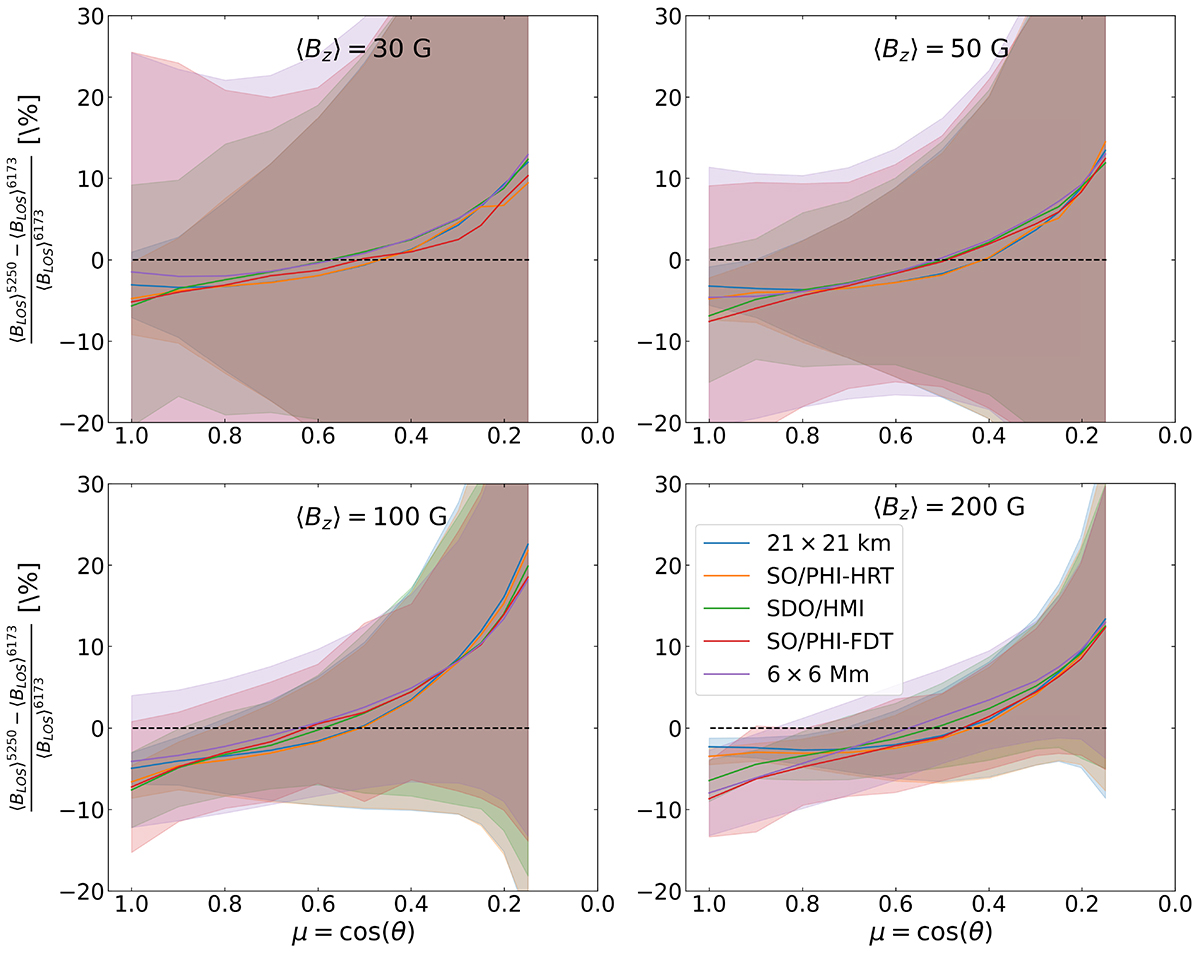
Download original image
Relative differences of ⟨BLOS⟩, in %, between the 5250.2 and 6173.3 Å spectral lines. From the top left panel clockwise: for ⟨BZ⟩ = 30, 50, 100, 200 G respectively. At each μ the retrieved ⟨BLOS⟩ quantities are averaged over all snapshots and viewing directions. The shaded regions denote the propagated standard deviation of the difference. The y axis is saturated from −20% to +30%. The legend in the upper left panel is valid for all panels. The dashed black line indicates the zero level.
Current usage metrics show cumulative count of Article Views (full-text article views including HTML views, PDF and ePub downloads, according to the available data) and Abstracts Views on Vision4Press platform.
Data correspond to usage on the plateform after 2015. The current usage metrics is available 48-96 hours after online publication and is updated daily on week days.
Initial download of the metrics may take a while.