Fig. 6.
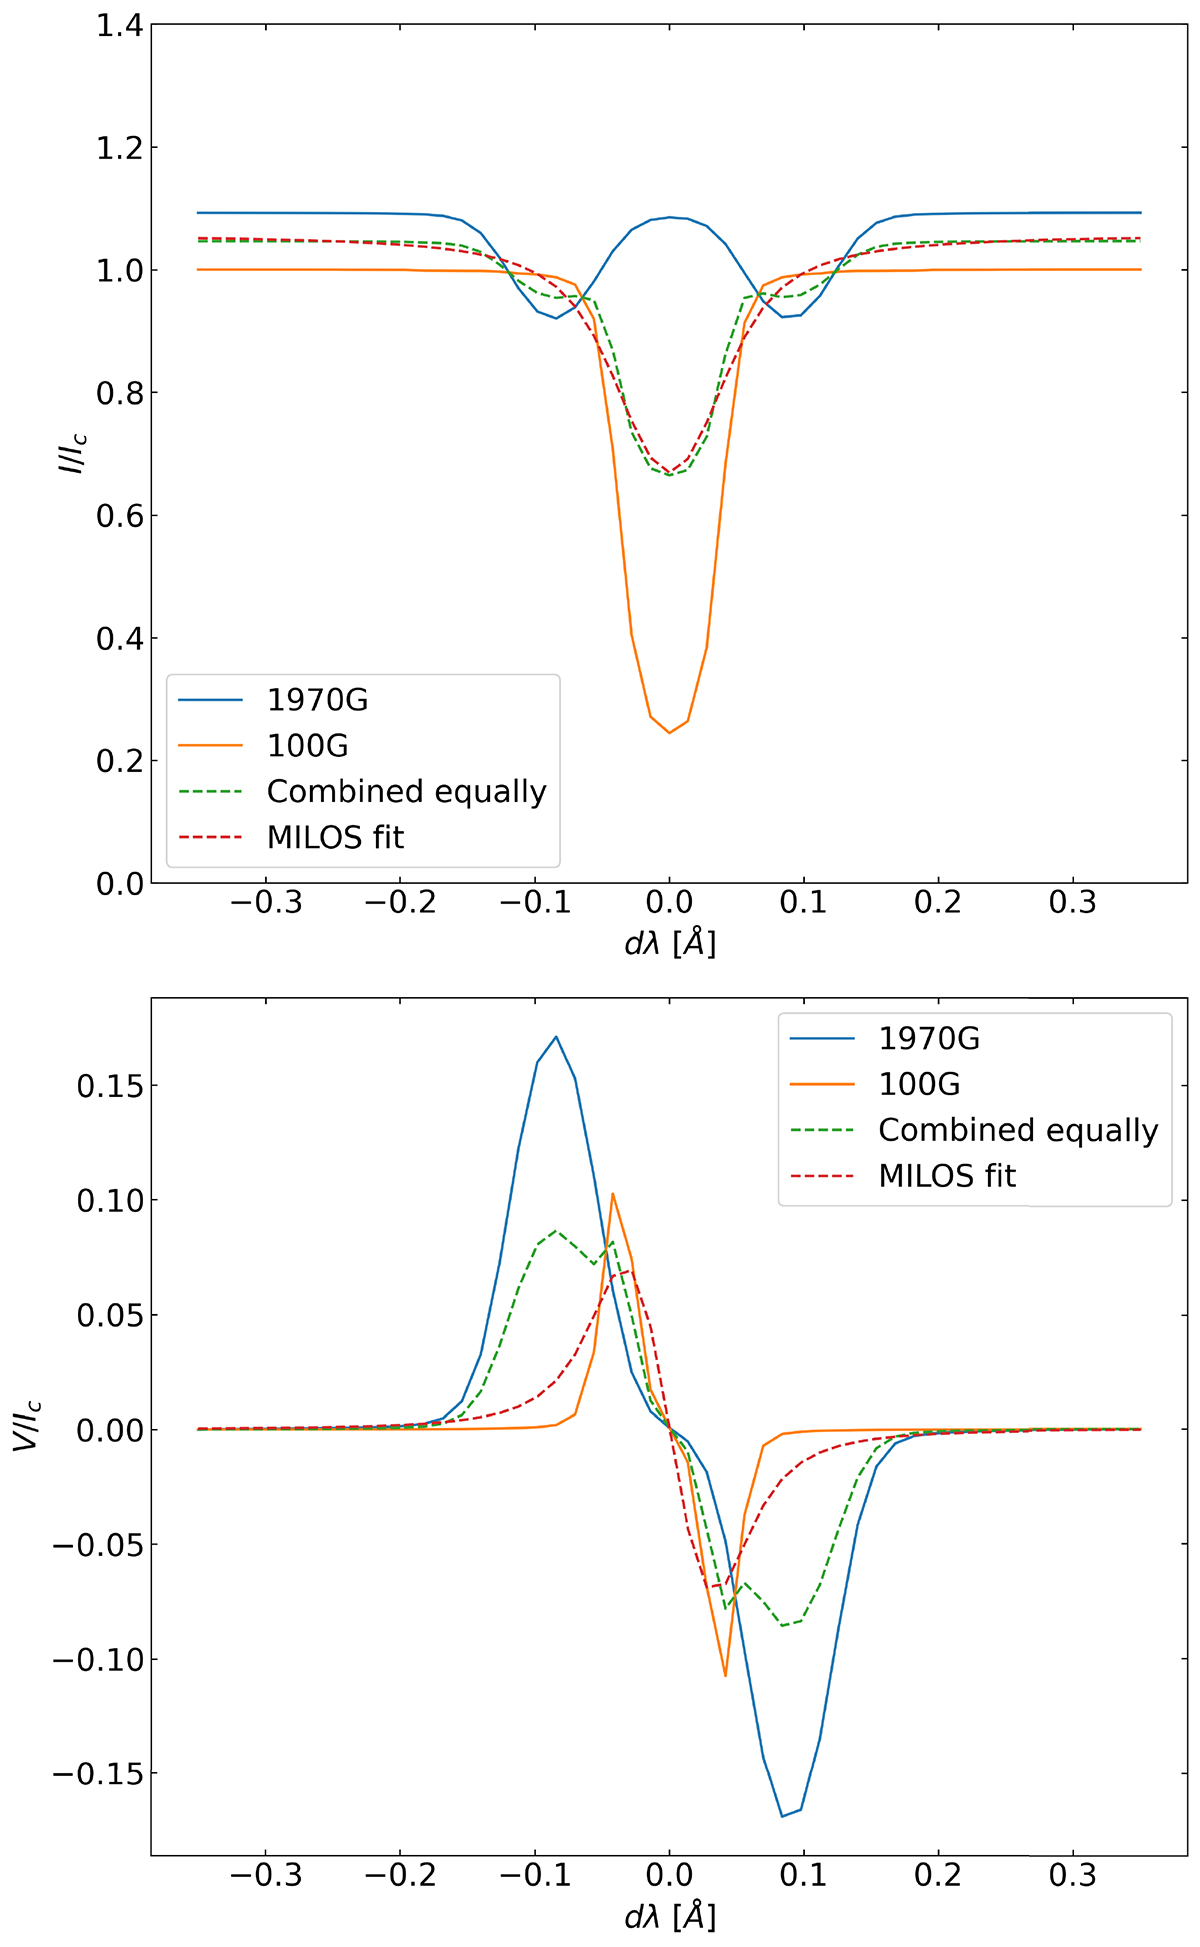
Download original image
Combination of Stokes signals from weak and strong magnetic regions for λ0 = 6173.3 Å. Top panel: Stokes I profiles for a ≈2000 G pixel and a 100 G pixel. The combined profile, a simple average of the individual profiles, is depicted by the dashed green line, while the fit to the combined profile is the dashed red line. Bottom panel: same as the top but for Stokes V.
Current usage metrics show cumulative count of Article Views (full-text article views including HTML views, PDF and ePub downloads, according to the available data) and Abstracts Views on Vision4Press platform.
Data correspond to usage on the plateform after 2015. The current usage metrics is available 48-96 hours after online publication and is updated daily on week days.
Initial download of the metrics may take a while.