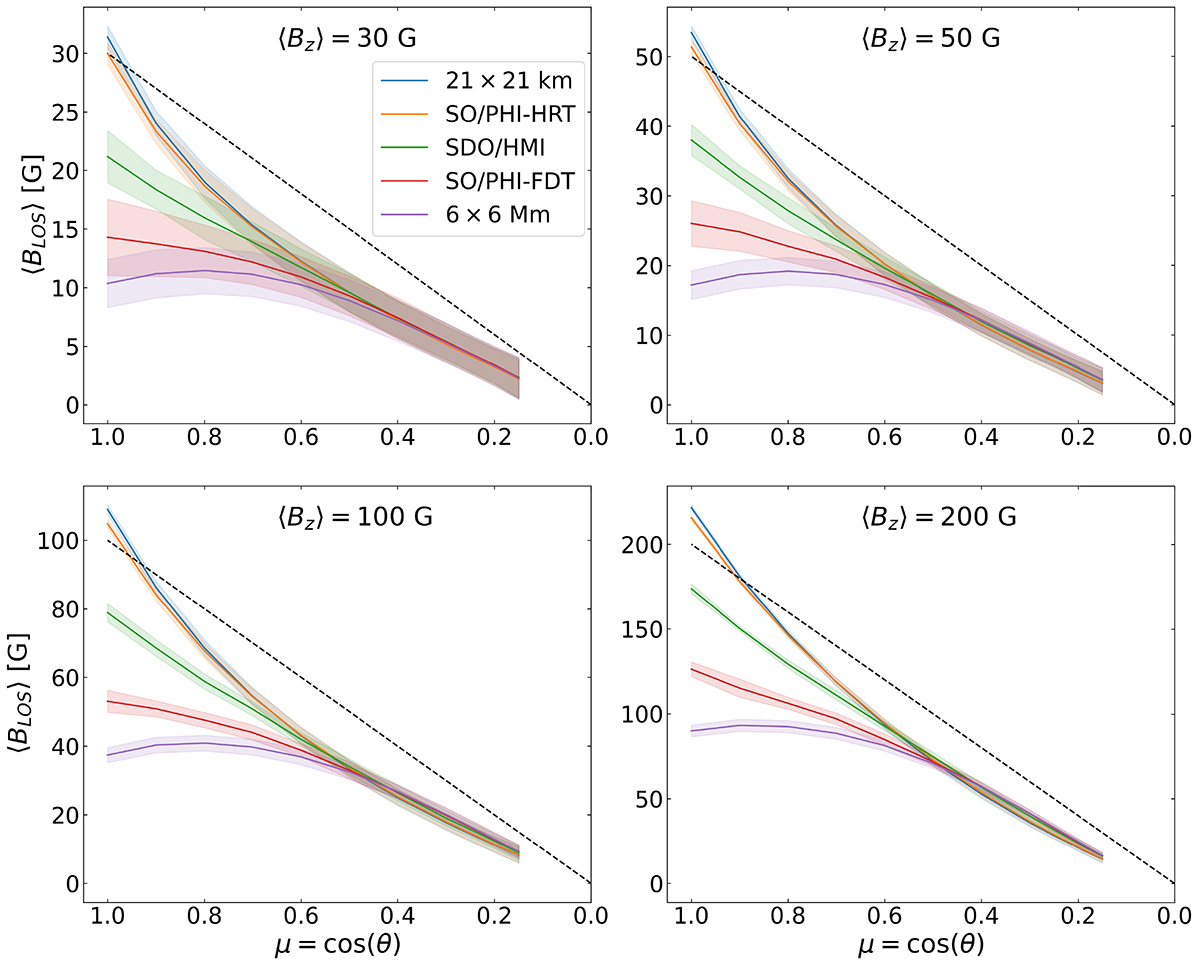
Fig. 4.
Download original image
⟨BLOS⟩(μ) retrieved from the λ0 = 6173.3 Å line at the five tested resolutions. From the top left panel clockwise: results for simulations with ⟨BZ⟩ = 30, 50, 100, 200 G respectively. At each μ the retrieved ⟨BLOS⟩ quantities are averaged over all snapshots and the two employed viewing directions. The shaded regions denote the standard deviation over the range of snapshots. The legend in the upper left panel is valid for all panels. The dashed black lines indicate the expected μ-dependence under the assumption that the ‘ground truth’ ⟨BZ⟩ is retrieved at μ = 1.
Current usage metrics show cumulative count of Article Views (full-text article views including HTML views, PDF and ePub downloads, according to the available data) and Abstracts Views on Vision4Press platform.
Data correspond to usage on the plateform after 2015. The current usage metrics is available 48-96 hours after online publication and is updated daily on week days.
Initial download of the metrics may take a while.