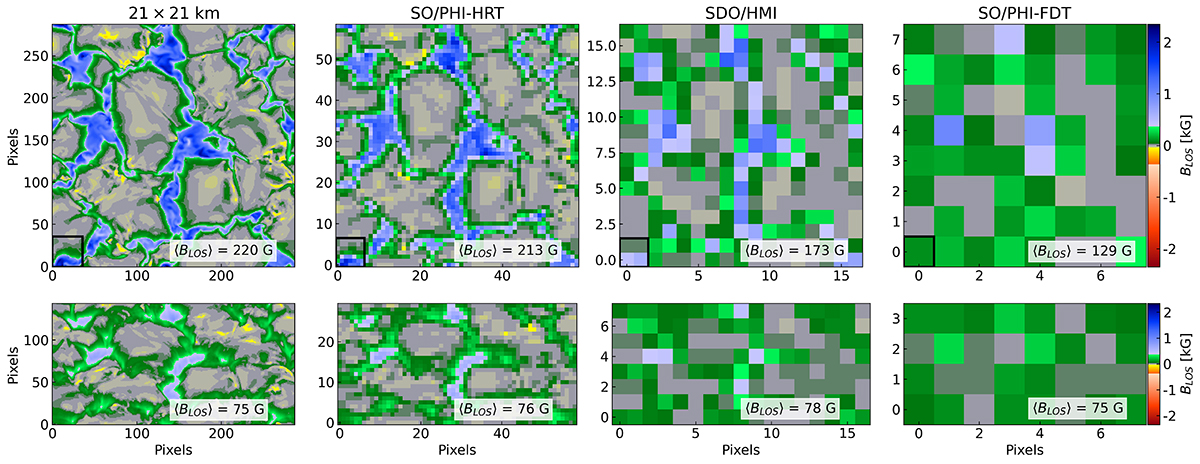
Fig. 3.
Download original image
BLOS, derived via MILOS inversions, from the Stokes profiles shown in Fig. 2. Top row: μ = 1, bottom row: μ = 0.5 in the ‘positive viewing’ direction with spatial foreshortening applied. The BLOS maps are shown at the original MURaM resolution, SO/PHI-HRT resolution at perihelion, SDO/HMI resolution and SO/PHI-FDT resolution, also at perihelion. The spatially averaged value of BLOS is inscribed at the lower-right in each panel. The black squares outline the region considered in Fig. 7.
Current usage metrics show cumulative count of Article Views (full-text article views including HTML views, PDF and ePub downloads, according to the available data) and Abstracts Views on Vision4Press platform.
Data correspond to usage on the plateform after 2015. The current usage metrics is available 48-96 hours after online publication and is updated daily on week days.
Initial download of the metrics may take a while.