Fig. 2.
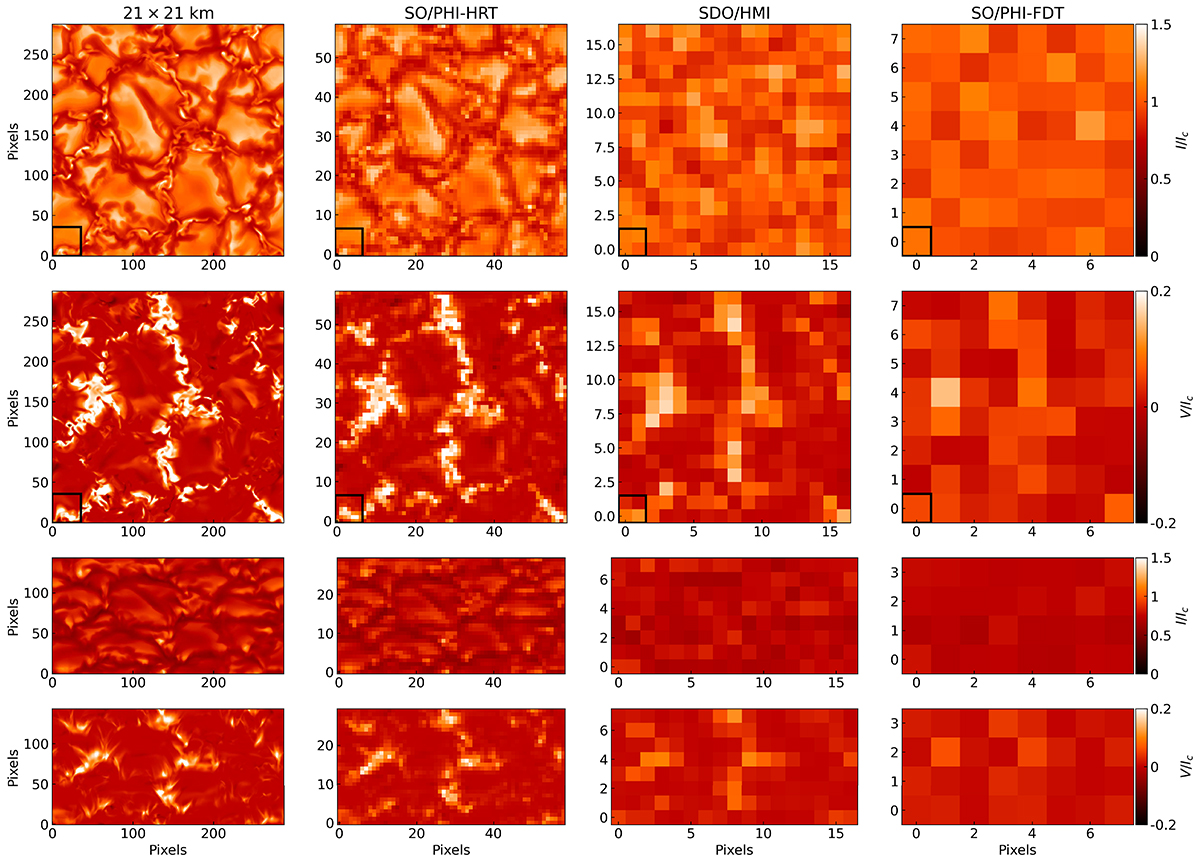
Download original image
Maps of synthesised Stokes I/Ic and V/Ic profiles for the λ0 = 6173.3 Å absorption line for one snapshot at ⟨BZ⟩ = 200 G at different spatial resolutions. Left to right columns: Original MURaM resolution, resolution of SO/PHI-HRT at perihelion, SDO/HMI resolution, and resolution of SO/PHI-FDT at perihelion. Top two rows: maps at μ = 1. Bottom two rows: maps at μ = 0.5 in the ‘positive viewing’ direction with spatial foreshortening applied. Top and third row: Stokes I/Ic at dλ = −0.35 Å. Second and fourth row: Stokes V/Ic at dλ = −0.07 Å. The black squares outline the region that is considered in Fig. 7.
Current usage metrics show cumulative count of Article Views (full-text article views including HTML views, PDF and ePub downloads, according to the available data) and Abstracts Views on Vision4Press platform.
Data correspond to usage on the plateform after 2015. The current usage metrics is available 48-96 hours after online publication and is updated daily on week days.
Initial download of the metrics may take a while.